 Market Insights
 2024-07-05
In 2022, global sales of peppermint oils from all exporting countries reached a total of US$160.2 million.
Overall, peppermint oil exports decreased by an average of -15.1% since 2018, when the global export value was $188.7 million. Year over year, the dollar value of peppermint exports also saw a decline of -15.1% compared to the $188.7 million recorded in 2021.
The top 5 peppermint exporters—India, the United States, Germany, France, and the United Kingdom—accounted for 89.1% of the worldwide sales of exported peppermint in 2022.
From a continental perspective, Asian countries sold the highest value of exported peppermint in 2022, with shipments totaling $69.4 million, or 43.3% of the global total. North America followed with 34.2%, while Europe accounted for 21.4% of international peppermint sales. Smaller percentages came from Oceania (0.6%), primarily Australia, Latin America (0.4%) excluding Mexico but including the Caribbean, and Africa (0.1%).
Focusing on peppermint importers, the top five countries in 2022 were the United States, Germany, Japan, mainland China, and the United Kingdom. Together, these countries purchased 45% of the globally imported peppermint.
These figures indicate a more concentrated group of 63 peppermint exporters (89.1% for the top five suppliers) compared to 144 importing countries, islands, and territories, with 45% for the top five importers.
From a continental viewpoint, 40.6% of globally imported peppermint was delivered to Asian countries, closely followed by Europe (37.6%), North America (17%), Latin America (2.3%) excluding Mexico but including the Caribbean, Oceania (1.3%) primarily Australia, and Africa (1.2%).
In 2022, the average price per ton of peppermint oil paid by importers was $34,025, reflecting a 4.4% increase from the average rate of $32,593 per ton in 2021.
For classification purposes, the 6-digit Harmonized Tariff System code prefix for peppermint oils is 330134.

Top Peppermint Exporters by Country
Below are the top 15 countries that exported the highest dollar value worth of peppermint during 2022:
1. India: US$67.3 million (42% of total peppermint exports)
2. United States: $54.1 million (33.7%)
3. Germany: $10.3 million (6.4%)
4. France: $5.9 million (3.7%)
5. United Kingdom: $5.1 million (3.2%)
6. Netherlands: $3.8 million (2.4%)
7. Switzerland: $1.9 million (1.2%)
8. Spain: $1.7 million (1.1%)
9. Croatia: $1.6 million (1%)
10. Australia: $941,000 (0.6%)
11. Ireland: $722,000 (0.5%)
12. Italy: $680,000 (0.4%)
13. Poland: $673,000 (0.4%)
14. Canada: $668,000 (0.4%)
15. China: $538,000 (0.3%)
By value, these 15 countries accounted for 97.3% of globally exported peppermint in 2022.
Among the top exporters, the fastest-growing exporters of peppermint since 2021 were Poland (up 284.6%), Italy (up 41.4%), and the United Kingdom (up 5.7%).
Countries with the largest declines in exported peppermint sales included Canada (down -46.9% from 2021), Ireland (down -41.2%), Croatia (down -40.5%), Australia (down -35.5%), and the United States (down -23.8%).
Top Peppermint Importers by Country
Overall spending on imported peppermint fell by -10.6% over the 5-year period starting in 2018 and declined by -7.9% since 2021.
Below are the top 15 countries that imported the highest dollar value of peppermint during 2022:
1. United States: US$22.9 million (12.4% of total imported peppermint)
2. Germany: $16.6 million (9%)
3. Japan: $14.4 million (7.8%)
4. China: $13.5 million (7.3%)
5. United Kingdom: $11.7 million (6.3%)
6. Hong Kong: $9.8 million (5.3%)
7. France: $9.7 million (5.3%)
8. Indonesia: $9.5 million (5.2%)
9. Netherlands: $9.2 million (5%)
10. Switzerland: $7.4 million (4%)
11. India: $5.4 million (2.9%)
12. Malaysia: $4.3 million (2.3%)
13. South Korea: $4 million (2.2%)
14. Italy: $3.7 million (2%)
15. Mexico: $3.4 million (1.8%)
By value, these 15 countries bought 80.4% of globally imported peppermint in 2022.
Among the top importers, the fastest-growing since 2021 were Switzerland (up 26.9%), Germany (up 20%), South Korea (up 8.9%), and the United Kingdom (up 8.7%).
Countries with the largest declines in imported peppermint sales included Malaysia (down -41.1% from 2021), India (down -29.1%), Indonesia (down -22.1%), mainland China (down -11.6%), and Japan (down -7.6%).
Top Peppermint Exporters by Company
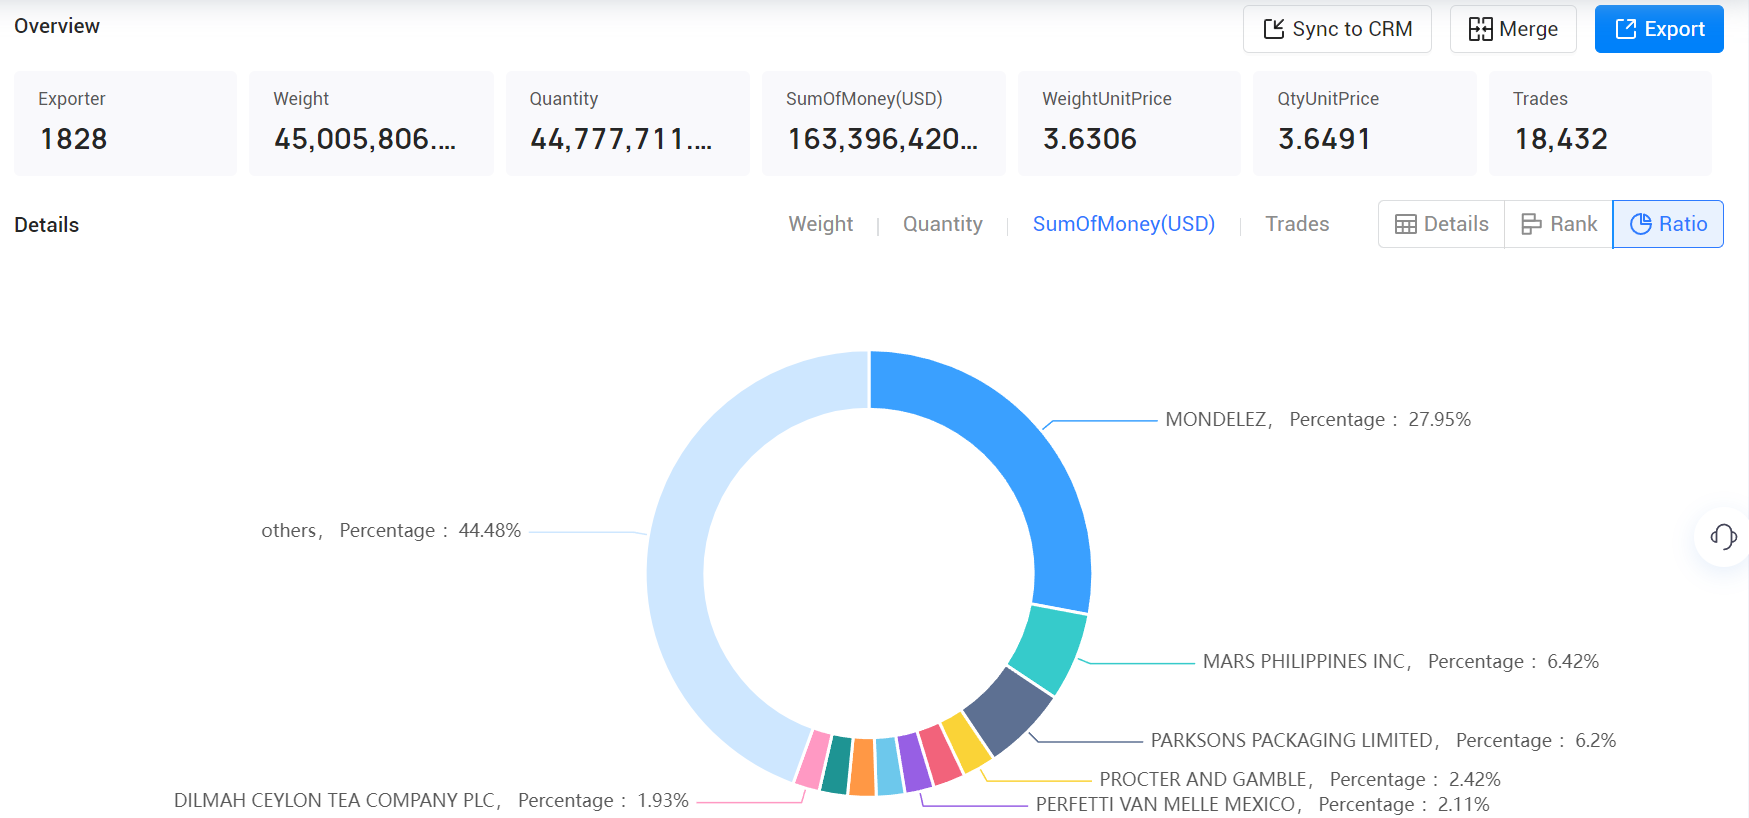
Below are the top 10 companies that exported the highest dollar value of peppermint during 2023:
1.MONDELEZ(27.95%, $45.67 Million)
2.MARS PHILIPPINES INC(6.42%, $10.48 Million)
3.PARKSONS PACKAGING LIMITED(6.2%, $10.13 Million)
4.PROCTER AND GAMBLE(2.42%, $3.95 Million)
5.CCC DIŞ TİCARET ANONİM ŞİRKETİ(2.32%, $3.79 Million)
6.PERFETTI VAN MELLE MEXICO(2.11%, $3.45 Million)
7.AROMSA BESİN AROMA VE KATKI MADDELERİ SANAYİ VE TİCARET ANONİM ŞİRKETİ(2.07%, $3.38 Million)
8.UNIDAL(2.05%, $3.36 Million)
9.CALLISONS FLAVORS INDIA PRIVATE LIMITED(2.05%, $3.36 Million)
10.DILMAH CEYLON TEA COMPANY PLC(1.93%, $3.15 Million)
Top Peppermint Importers by Company
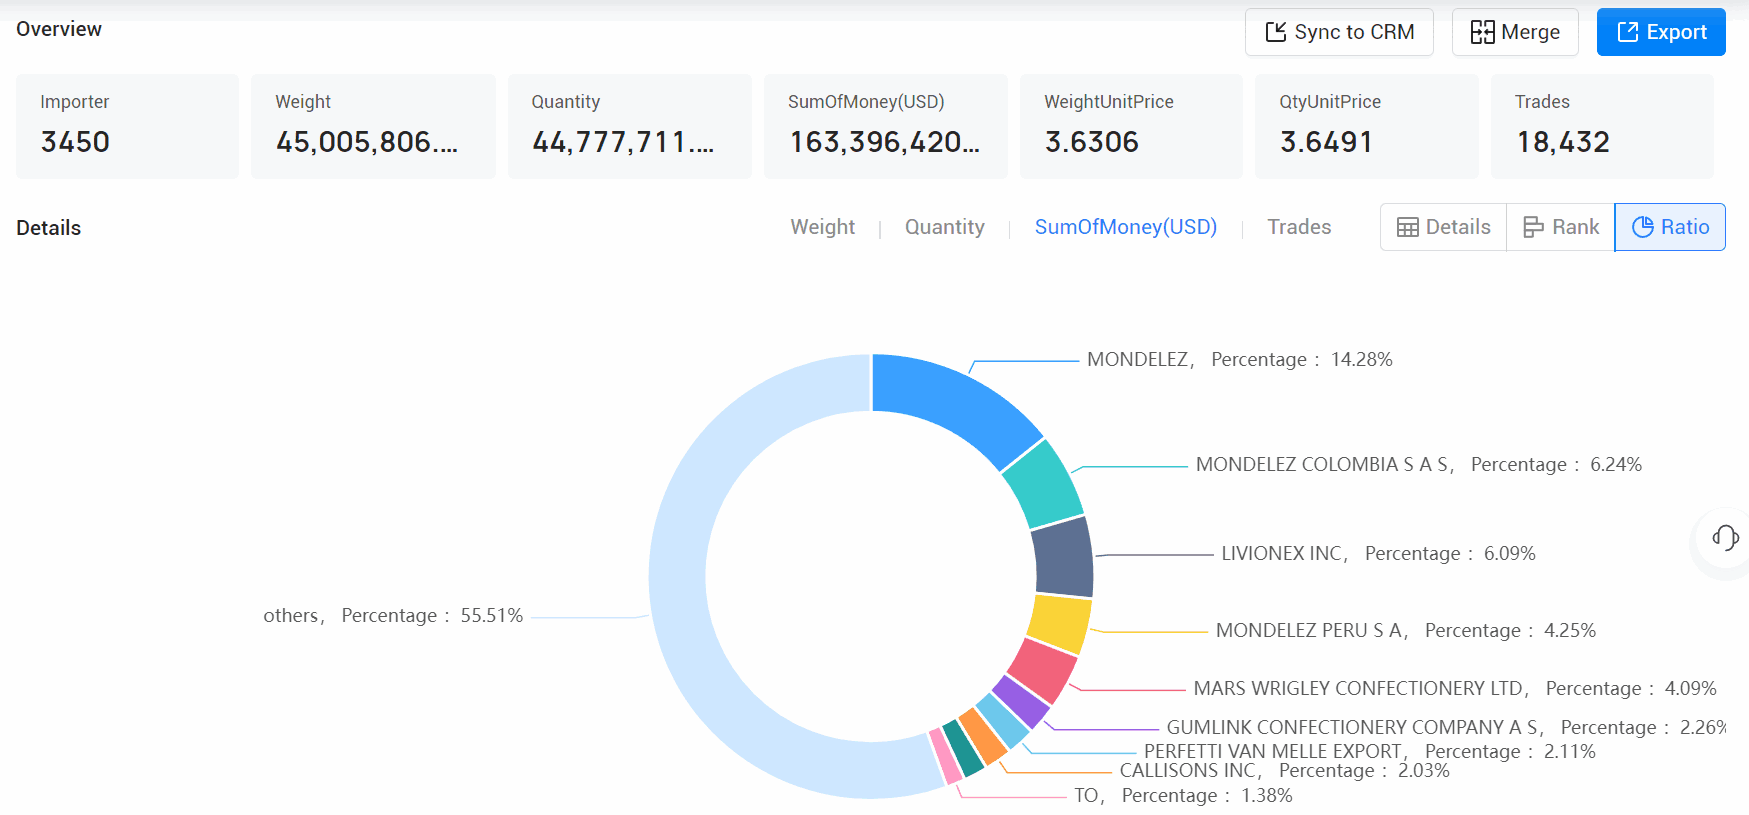
Below are the top 10 companies that imported the highest dollar value of peppermint during 2023:
1.MONDELEZ(14.28%, $23.33 Million)
2.MONDELEZ COLOMBIA S A S(6.24%, $10.19 Million)
3.LIVIONEX INC(6.09%, $9.95 Million)
4.MONDELEZ PERU S A(4.25%, $6.95 Million)
5.MARS WRIGLEY CONFECTIONERY LTD(4.09%, $6.68 Million)
6.GUMLINK CONFECTIONERY COMPANY A S(2.26%, $3.7 Million)
7.PERFETTI VAN MELLE EXPORT(2.11%, $3.45 Million)
8.CALLISONS INC(2.03%, $3.32 Million)
9.MARS VIETNAM COMPANY LIMITED(1.76%, $2.87 Million)
10.TO(1.38%, $2.26 Million)
Global Market Analysis
Analysis of the Overall Trade Situation and Trends in the Industry
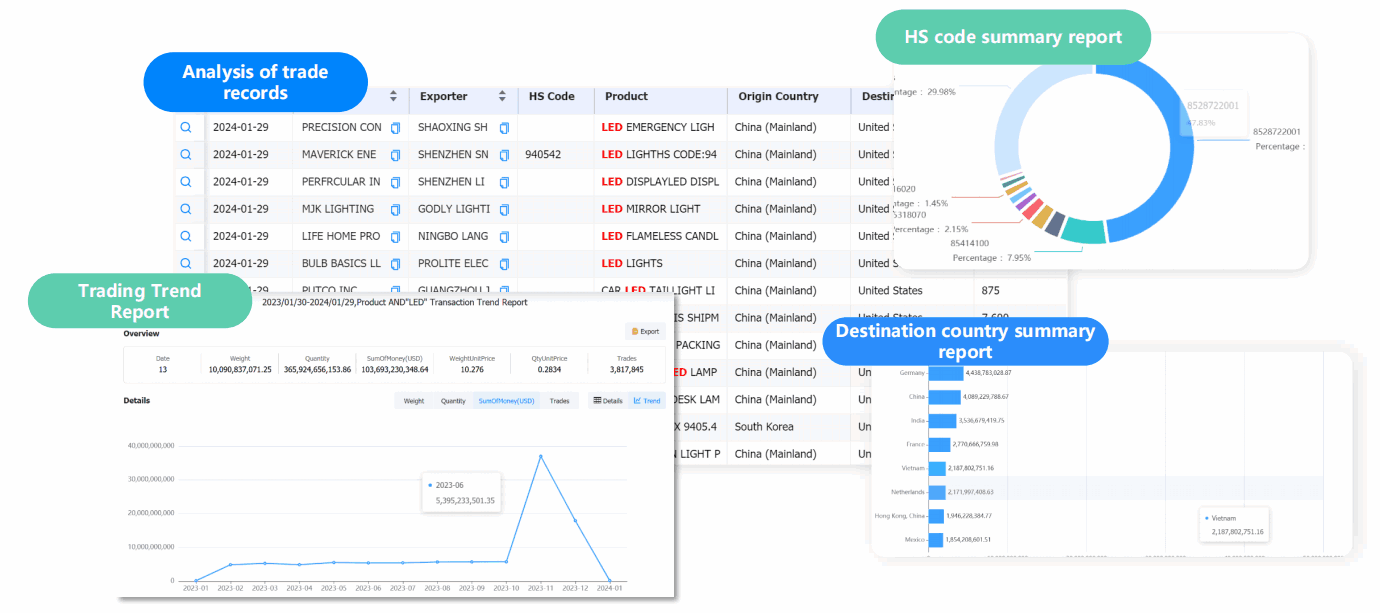
Through its powerful digital platform and in-depth reporting services, Tendata helps users to analyse the overall situation and future trends of the industry, so as to achieve more accurate market positioning and strategic planning.
Analysis of Specific Product Trade Trends in the Target Market
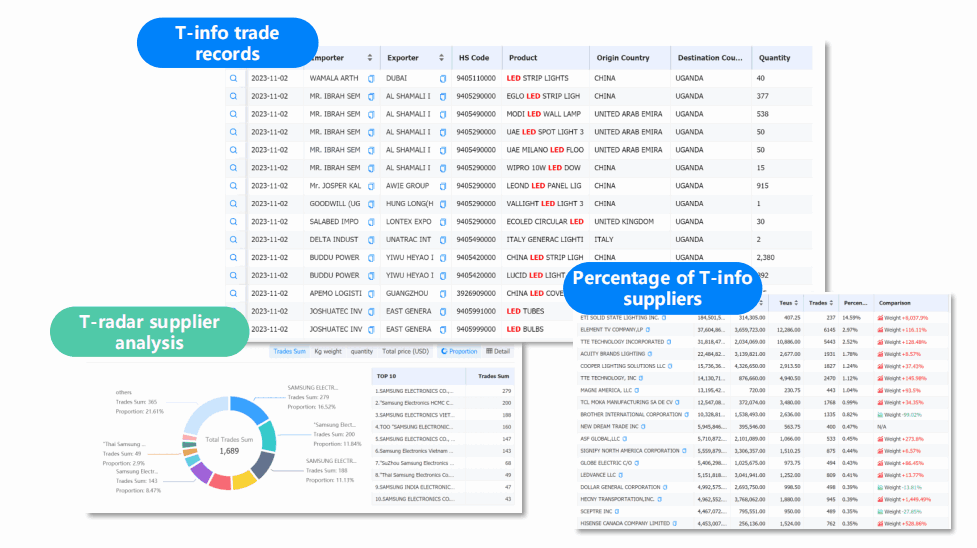
Tendata can provide comprehensive data support and analytical reports for analysing trade trends for a product in a single market, helping you to understand how that product is being traded in that market and identify business opportunities.
>>Get A Free Demo<<
Category
Leave Message for Demo Request or Questions


 T-info
 T-discovery

 My
Tendata
 Market Analysis
 Customer
Development
 Competitor
Monitoring
 Customer Relationship