 Market Insights
 2024-07-18
In 2022, the global trade of fresh plums reached a total value of US$994.6 million. This marks a notable increase of 21.5% from 2018, when the total export value was $818.6 million. However, compared to 2021, the export value saw a slight decline of -1.4%, dropping from $1 billion.
Plums, known for their juicy and flavorful flesh that ranges from sweet to tart, are a popular fruit consumed in various forms. Apart from being eaten raw, plums are also enjoyed as jams, juices, wines, and specialty snacks like dried and salted plums.
The top 5 exporters of fresh plums in 2022 were Chile, Spain, South Africa, Hong Kong, and Italy, collectively accounting for 65.6% of the global plum exports.

Plum Exports by Continent
In 2022, European countries led the export market with shipments valued at $341.8 million, representing 34.4% of the global total. Latin America (excluding Mexico but including the Caribbean) followed with 23.6%, closely trailed by Asia at 23.5%. Other contributing regions included Africa (11.8%), North America (4.6%), and Oceania (2.1%), primarily from Australia.
Here are the top 20 countries that exported the highest dollar value of fresh plums in 2022:
·Chile: US$234.4 million (23.6% of total plum exports)
·Spain: $133.2 million (13.4%)
·South Africa: $114.8 million (11.5%)
·Hong Kong: $110.9 million (11.1%)
·Italy: $59.5 million (6%)
·China: $52.2 million (5.2%)
·Netherlands: $47.8 million (4.8%)
·United States: $45.9 million (4.6%)
·Türkiye: $24.1 million (2.4%)
·Uzbekistan: $23.4 million (2.4%)
·Australia: $21.1 million (2.1%)
·Moldova: $15.1 million (1.5%)
·France: $14.7 million (1.5%)
·Serbia: $14.5 million (1.5%)
·Poland: $8.7 million (0.9%)
·Germany: $8.2 million (0.8%)
·Portugal: $6.3 million (0.6%)
·Austria: $6.2 million (0.6%)
·Bosnia/Herzegovina: $5.7 million (0.6%)
·Lebanon: $5.3 million (0.5%)
These 20 countries accounted for 95.7% of the global plum exports in 2022. The fastest-growing exporters since 2021 were Uzbekistan (up 139.6%), Austria (up 89.7%), Chile (up 48.3%), and Poland (up 21.3%). Conversely, Lebanon saw the most significant decline, with a -71.3% decrease from 2021, followed by Portugal (down -45.1%), Moldova (down -34.6%), Germany (down -25.9%), and Spain (down -20.4%).
Leading Importers of Fresh Plums
Global spending on imported plums increased by 17.6% over the five-year period starting in 2018 and rose by 4.4% from 2021 to 2022.
Here are the top 20 countries that imported the highest dollar value of fresh plums in 2022:
·China: US$270.2 million (23.6% of total imported plums)
·Hong Kong: $122.6 million (10.7%)
·Germany: $65.5 million (5.7%)
·United Kingdom: $64.6 million (5.6%)
·Netherlands: $59.2 million (5.2%)
·United States: $55.7 million (4.9%)
·Russia: $47.5 million (4.2%)
·Canada: $41.2 million (3.6%)
·Brazil: $39.3 million (3.4%)
·Vietnam: $37.7 million (3.3%)
·United Arab Emirates: $22 million (1.9%)
·France: $19.9 million (1.7%)
·Egypt: $19.7 million (1.7%)
·Poland: $18.1 million (1.6%)
·Belgium: $17.5 million (1.5%)
·Italy: $16.6 million (1.5%)
·Kazakhstan: $13.5 million (1.2%)
·Austria: $13.1 million (1.1%)
·Switzerland: $12.3 million (1.1%)
·Saudi Arabia: $10 million (0.9%)
These 20 countries bought 84.4% of globally imported plums in 2022. The fastest-growing importers since 2021 were Vietnam (up 1,489%), Kazakhstan (up 112.3%), mainland China (up 54.1%), and Egypt (up 22.5%). On the other hand, Saudi Arabia experienced the most significant decline with a -57.8% decrease, followed by France (down -31.6%), Italy (down -31.3%), Switzerland (down -20.6%), and Germany (down -19.9%).
Prices and Tariff Codes
In 2022, the average unit price paid by plum importers was $1,460 per ton, reflecting a -1.9% decrease from the 2021 average of $1,489 per ton. For research purposes, the Harmonized Tariff System code for fresh plums, including sloes, is 080940.
This overview provides a comprehensive look at the leading exporters and importers of fresh plums by country, highlighting significant trends and data in the global plum market.
Retrieve Global Trade Data and Monitor Market Trends
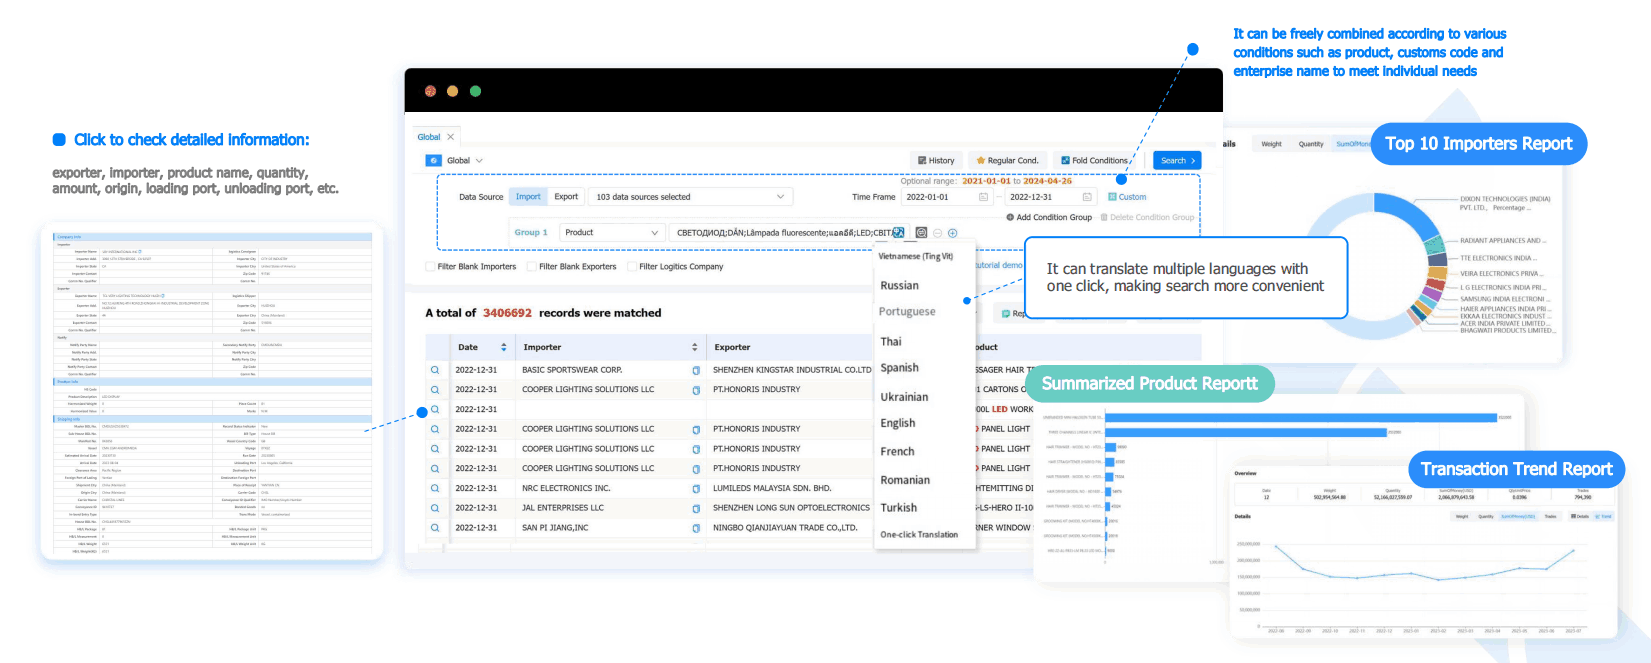
Tendata support one-click queries to track the global transaction details of specific products. Reflect the purchasing and supply activities throughout the entire supply chain and comprehensively display the state of the entire trade network.
Based on the statistical analysis of transaction data, view industry and product market trends to help businesses gain insights into market changes.
Tendata provides real-time, accurate, and detailed customs data, presenting the specifics of each transaction. Customized search criteria meet various filtering needs.

Category
Leave Message for Demo Request or Questions


 T-info
 T-discovery

 My
Tendata
 Market Analysis
 Customer
Development
 Competitor
Monitoring
 Customer Relationship


