 Market Insights
 09-05-2025
As a key alternative to traditional internal combustion engine vehicles, New Energy Vehicles (NEVs) have received growing global attention and witnessed rapid development in recent years. The main types include Battery Electric Vehicles (BEVs), Plug-in Hybrid Electric Vehicles (PHEVs), and Fuel Cell Electric Vehicles (FCEVs). The market share of electric vehicles in global auto sales has steadily increased — from 4% in 2020, to 9% in 2021, 14% in 2022, 16% in 2023, and 22% in 2024. Notably, in December 2024, EVs captured 30% of the market share — a record high.
Many companies are now eager to know how to access NEV import and export data. This article provides a detailed analysis of the main channels for querying this data.

I. Overview of the Global NEV Market in 2024
1. Market Size
New Energy Vehicles refer to cars that use new types of power systems and are fully or primarily powered by new energy sources. This includes plug-in hybrid vehicles (including range-extended types), pure electric vehicles, and fuel cell vehicles.
In 2023, the global NEV market size reached USD 505.267 billion, with a compound annual growth rate (CAGR) of 35.41% over the past five years. Preliminary estimates suggest that in 2024, the market will grow to USD 582.1 billion.
The overall global auto market in 2024 maintained a steady growth trend, with annual vehicle sales reaching around 95 million units, a 2% year-on-year increase—a slower pace than in 2023. This growth was mainly driven by the continued recovery of the supply chain and the gradual release of pent-up demand. Meanwhile, the NEV market continued its rapid rise, with total global sales reaching 18.24 million units, up 24% year-on-year, though the momentum was slightly weaker than in 2023 due to a slowdown in the U.S. and European markets.
2. Regional Market Highlights Worth Watching
China accounted for 63% of the global NEV market.
In Europe, led by Germany and France, traditional automakers like Volkswagen, Mercedes-Benz, and BMW are accelerating their shift to electrification, with strong policy support.
In the U.S., Tesla continues to lead in innovation and global expansion.
Japanese and Korean automakers, such as Toyota and Hyundai, are also actively advancing their electrification strategies, contributing to increasingly intense global competition.
· Europe
The European market can be divided into Western Europe and Central & Eastern Europe.
Western Europe, with its strong economy and high population density, accounts for 80% of Europe's vehicle sales, with over 15 million passenger cars sold in 2024, on par with the U.S. market. The "Big Four" markets—Germany, the UK, France, and Italy—make up more than half of this volume.
NEV penetration in Western Europe remains at 24%, while Central and Eastern Europe, despite rapid growth, still lags behind at 4%.
In terms of market share by brand:
Western Europe is dominated by European brands, accounting for nearly 70% of the market. Chinese brands have made notable inroads through their NEV offerings, reaching about 3% market share.
In Central and Eastern Europe, there's a more diverse mix of European, Chinese, Russian, and Japanese brands, with Chinese brands holding a 27% share, largely due to strong performance in the Russian market.
· Middle East
In 2024, the Middle Eastern passenger car market (excluding Iran) recorded 2.96 million units sold, a 6% year-on-year increase. Including Iran (approx. 1.43 million units), the total regional market size reached 4.39 million units.
Turkey and Saudi Arabia make up the first tier, with annual sales in the millions.
The UAE and Israel form the second tier, with about 300,000 units each.
Other countries form a third tier, with annual sales around 100,000 units.
NEV sales in the region are mainly concentrated in Turkey and Israel, with total sales reaching 140,000 units in 2024.
Turkey sold 74,000 units (NEV penetration: 6%)
Israel sold 57,000 units (NEV penetration: 21%)
3. Industry Competition
The global NEV market is increasingly showing characteristics of oligopoly, led by Tesla and BYD:
Tesla dominates through its technological innovation and global deployment.
BYD has shown robust growth in the Chinese market and commercial vehicle sector.
Meanwhile, emerging Chinese brands such as NIO, XPeng, and Li Auto are rising quickly by offering intelligent, high-performance vehicles.
Legacy automakers like Volkswagen, Mercedes-Benz, and BMW are also accelerating their transition to electric vehicles to secure their place in the evolving landscape.
Overall, the NEV industry is marked by diversified competition, rapid technological innovation, and fast-paced market expansion.

II. Channels for Querying Import and Export Data of New Energy Vehicles (NEVs)
1. Official Customs Channels:
(1) General Administration of Customs Website:
For example, the official website of the General Administration of Customs of China offers import and export data query services. After accessing the site, you can navigate to sections such as “Data & Statistics” or “Import and Export Statistics”. Based on your needs, you can set specific search criteria — such as product names (e.g., “new energy vehicles” or specific types like “battery electric vehicles” or “plug-in hybrid vehicles”), time range, and export/import countries or regions — to obtain relevant NEV trade data. Data is usually updated monthly, with the previous month's details released in the first half of the following month.
(2) Local Customs Websites:
Regional customs offices may also provide data query services for their respective jurisdictions. For example, if you want to analyze NEV export data from a specific area, you can visit that region's customs website and look for sections like “Government Information Disclosure” or “Local Customs Statistics” for relevant details.
(3) Industry Associations and Related Institutions:
·NEV Industry Associations:
These associations often collect and organize data related to the NEV sector, including export statistics. Visit their official websites to check if they offer access to data services. Some associations may offer free access, while others may require membership or paid subscriptions for more detailed data.
·Automotive Industry Institutions:
Organizations such as the China Association of Automobile Manufacturers (CAAM) regularly release reports on the automotive industry, which often include NEV export data. You can follow their official channels or media outlets to obtain these updates.
2. Import and Export Data Platforms
Using Tendata to Query NEV Import/Export Data:
First, visit Tendata. In the T-Info search bar, enter terms like “Electric Vehicle” to access comprehensive global NEV import/export data.
>>> Apply to Tendata for Free NEV Data Access <<<
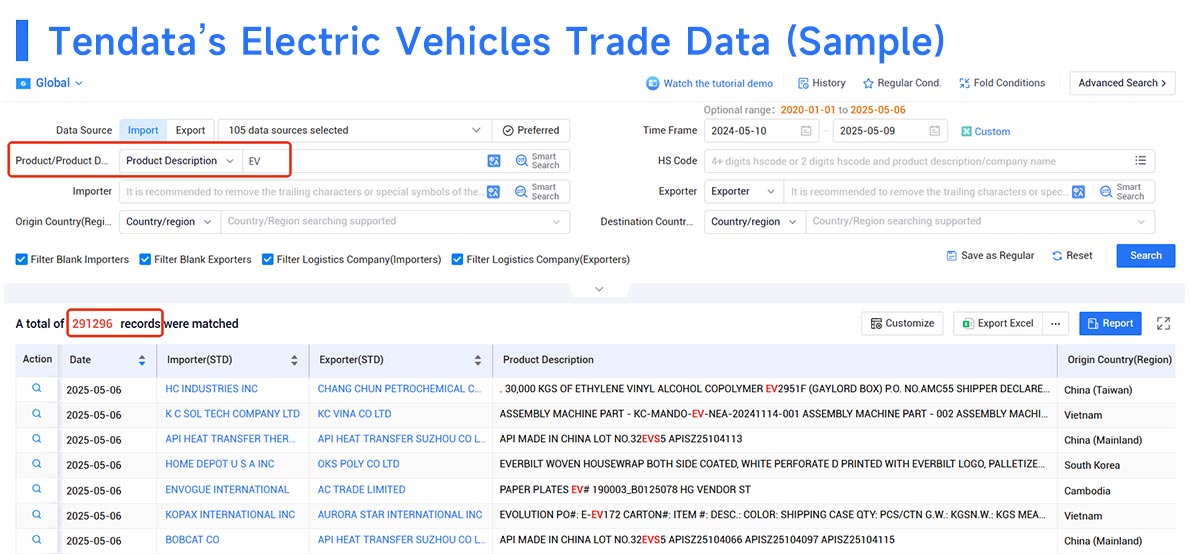
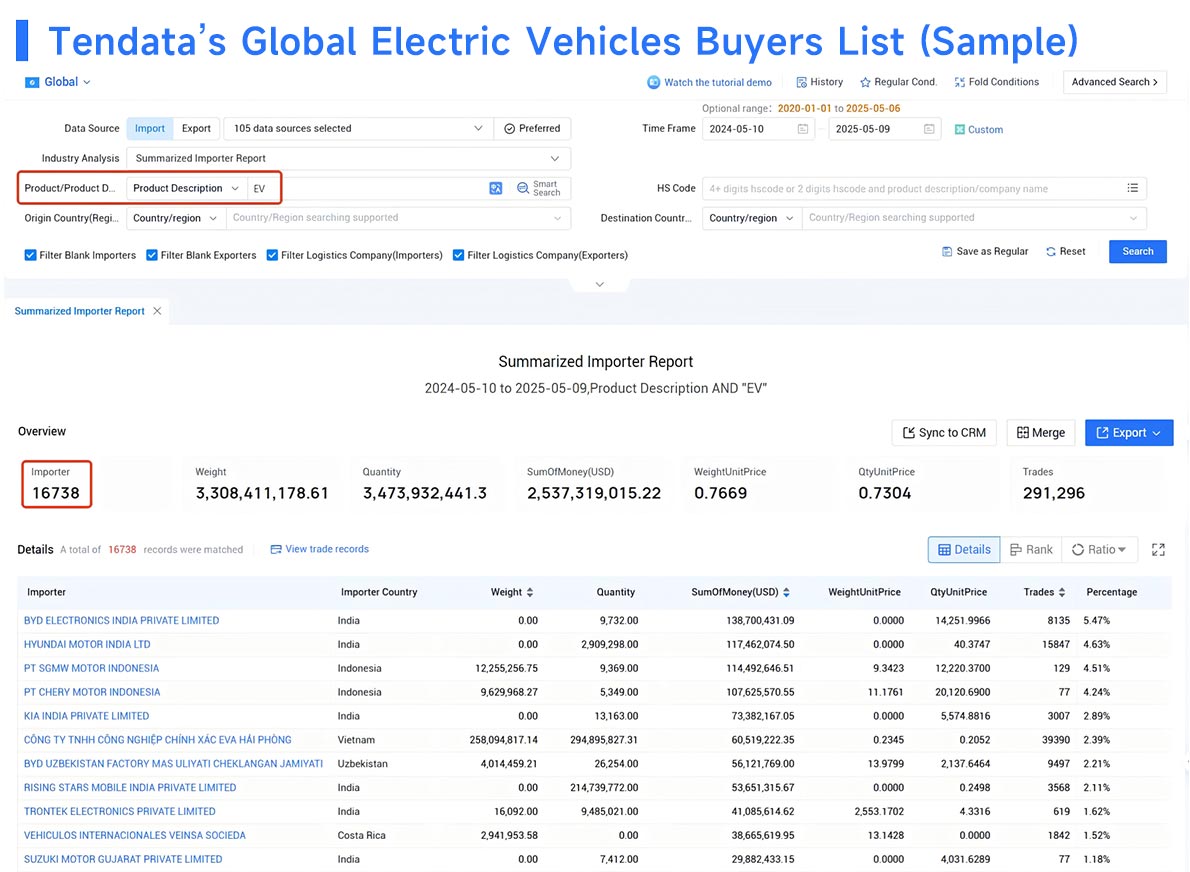
You can analyze both global and country-specific NEV import/export data for trade research and market analysis. You can also find EV buyers and suppliers from Tendata global trade data platform.
>>> Analyze NEV Trade Data via Tendata <<<
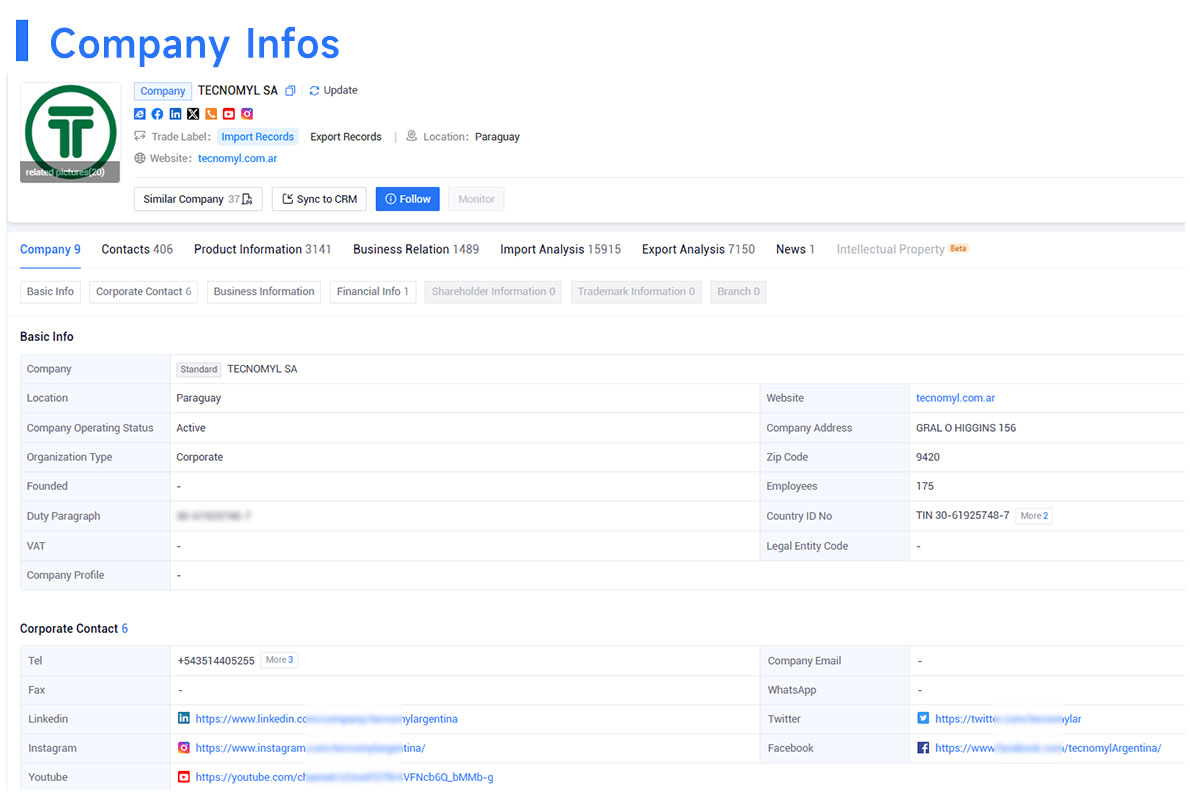
You can also analyze data by company, viewing detailed information about buyers, key decision-makers, executives, and their contact details — including email, LinkedIn, and Facebook accounts. Conveniently, Tendata also links directly to social platforms like LinkedIn, helping businesses quickly establish contact with their target clients.
>>> Use Tendata to Find Potential NEV Export Clients <<<
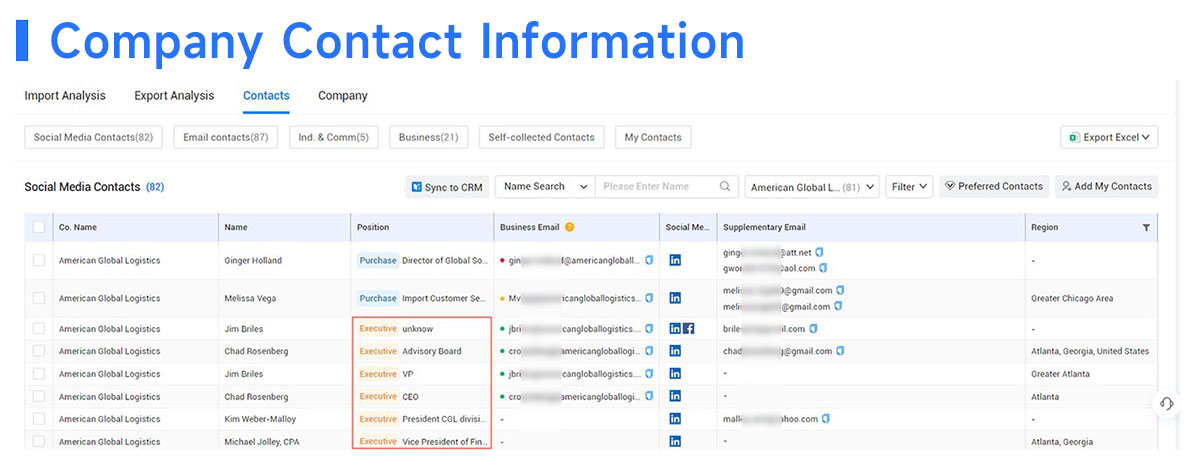
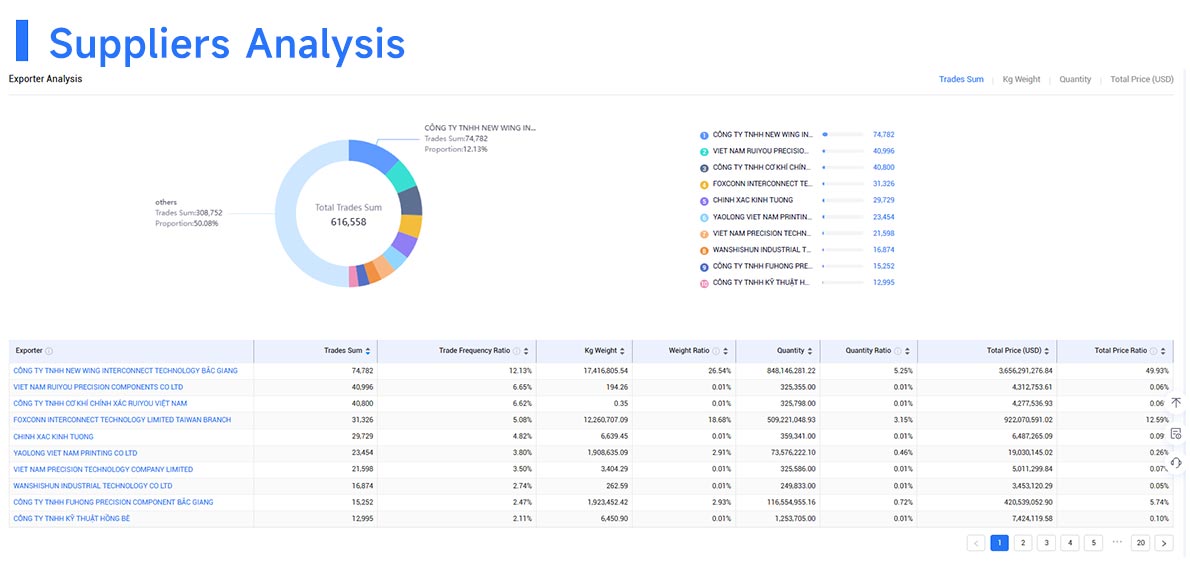
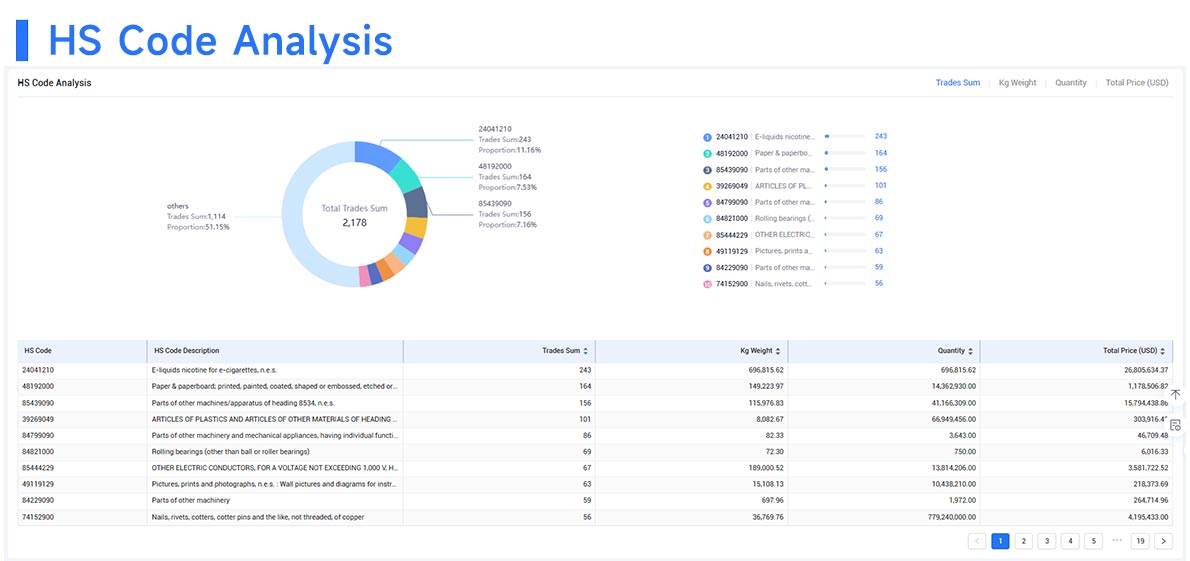
These are the main methods for querying new energy vehicle import and export data. We hope this helps businesses precisely identify and develop global NEV customers.
Category
Leave Message for Demo Request or Questions


 T-info
 T-discovery

 My
Tendata
 Market Analysis
 Customer
Development
 Competitor
Monitoring
 Customer Relationship


