 Trade Data
 2025-07-25
As of 2024, global black pepper exports amounted to approximately US$2.7 billion.
Compared to five years earlier in 2020, when black pepper exports totaled $1.57 billion, the industry has seen a 71.5% growth in export value. On a year-over-year basis, export revenues grew by 35.5% from $2 billion in 2023 to $2.7 billion in 2024.
Black pepper remains the most widely traded spice globally by volume. It is a staple seasoning, commonly paired with salt, and is typically found on dining tables in either shaker or grinder form.
Geographic Trends in Black Pepper Trade
In terms of export value, the top five exporters of black pepper in 2024 were Vietnam, Indonesia, Brazil, Sri Lanka, and India. Together, these countries accounted for roughly 76% of all black pepper exports globally.
On the import side, the five largest buyers were the United States, India, Vietnam, Germany, and France. Combined, these nations imported approximately 48.6% of the total global value of black pepper.
This data indicates that black pepper exports are more concentrated among a few suppliers (124 countries total, with the top 5 representing 76%) than imports, which are spread across about 200 nations, territories, and regions. The import market is comparatively less centralized, with the top five importers representing a smaller share of the total.
Continental Insights
From a continental perspective, Asia led in black pepper export value in 2024, shipping goods worth $1.92 billion, which translates to 71.5% of the world total. Europe ranked second with 12.7%, followed by Latin America (excluding Mexico but including the Caribbean) with 11.3%. Smaller contributions came from North America (3%), Africa (1.4%), and Oceania (0.1%), with Australia as the primary source.
When looking at imports by region, Asia again led with 39.1% of global purchases, trailed by Europe at 28.2%. Other importing regions included North America (24.7%), Africa (4.3%), Latin America (2.1%), and Oceania (1.5%), mainly from Australia and New Zealand.
Trade Classifications and Product Forms
For trade tracking, black pepper falls under the Harmonized Tariff System (HTS) codes 090411 for whole (uncrushed) pepper, and 090412 for pepper that is crushed or ground.
Further breakdown reveals that 75% of black pepper exports by value in 2024 were for whole pepper, while the remaining 25% was for crushed or ground pepper, which is a slight decrease from 27.5% in the previous year.

Top Black Pepper Exports by Company
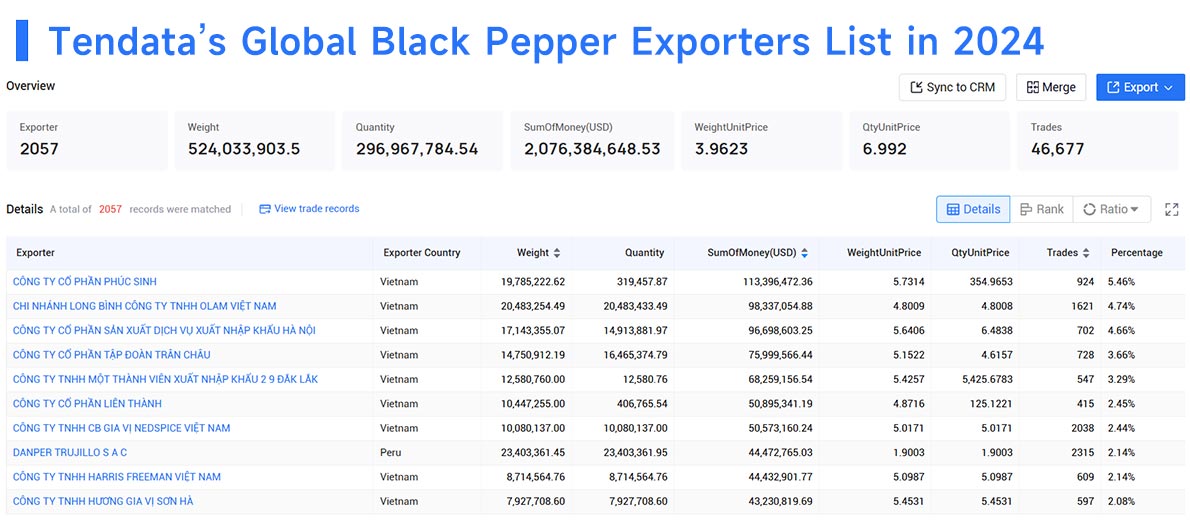
According to Tendata's global trade database, the following are the top 10 black pepper exporters in terms of market share and dollar value:
1.CÔNG TY CỔ PHẦN PHÚC SINH(5.46%, $113.4 Million)
2.CHI NHÁNH LONG BÌNH CÔNG TY TNHH OLAM VIỆT NAM(4.74%, $98.34 Million)
3.CÔNG TY CỔ PHẦN SẢN XUẤT DỊCH VỤ XUẤT NHẬP KHẨU HÀ NỘI(4.66%, $96.7 Million)
4.CÔNG TY CỔ PHẦN TẬP ĐOÀN TRÂN CHÂU(3.66%, $76 Million)
5.CÔNG TY TNHH MỘT THÀNH VIÊN XUẤT NHẬP KHẨU 2 9 ĐẮK LẮK(3.29%, $68.26 Million)
6.CÔNG TY CỔ PHẦN LIÊN THÀNH(2.45%, $50.9 Million)
7.CÔNG TY TNHH CB GIA VỊ NEDSPICE VIỆT NAM(2.44%, $50.57 Million)
8.DANPER TRUJILLO S A C(2.14%, $44.47 Million)
9.CÔNG TY TNHH HARRIS FREEMAN VIỆT NAM(2.14%, $44.43 Million)
10.CÔNG TY TNHH HƯƠNG GIA VỊ SƠN HÀ(2.08%, $43.23 Million)

Top Black Pepper Imports by Company
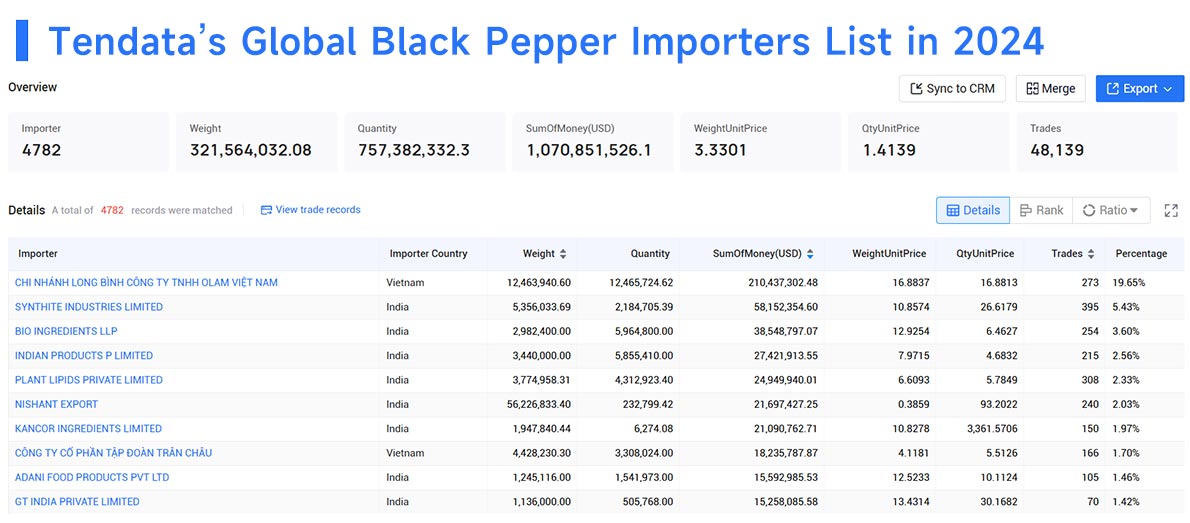
According to Tendata's global trade database, the following are the top 10 black pepper importers in terms of market share and dollar value:
1.CHI NHÁNH LONG BÌNH CÔNG TY TNHH OLAM VIỆT NAM(19.65%, $210.44 Million)
2.SYNTHITE INDUSTRIES LIMITED(5.43%, $58.15 Million)
3.BIO INGREDIENTS LLP(3.6%, $38.55 Million)
4.INDIAN PRODUCTS P LIMITED(2.56%, $27.42 Million)
5.PLANT LIPIDS PRIVATE LIMITED(2.33%, $24.95 Million)
6.NISHANT EXPORT(2.03%, $21.7 Million)
7.KANCOR INGREDIENTS LIMITED(1.97%, $21.09 Million)
8.CÔNG TY CỔ PHẦN TẬP ĐOÀN TRÂN CHÂU(1.7%, $18.24 Million)
9.ADANI FOOD PRODUCTS PVT LTD(1.46%, $15.59 Million)
10.GT INDIA PRIVATE LIMITED(1.42%, $15.26 Million)

Top Black Pepper Export Countries in 2024
The following are the 20 leading exporters of black pepper by export value in 2024, including all forms—whole, crushed, or ground:
1.Vietnam: US$1.2 billion (43.2% of global exports)
2.Indonesia: $311.3 million (11.6%)
3.Brazil: $285.9 million (10.6%)
4.Sri Lanka: $171.3 million (6.4%)
5.India: $114.1 million (4.2%)
6.Germany: $88.3 million (3.3%)
7.Netherlands: $75.2 million (2.8%)
8.United States: $47.7 million (1.8%)
9.Malaysia: $41 million (1.5%)
10.France: $40.2 million (1.5%)
11.Cambodia: $35.3 million (1.3%)
12.Mainland China: $33.6 million (1.2%)
13.Mexico: $25.7 million (1%)
14.Austria: $20.7 million (0.8%)
15.Spain: $19.5 million (0.7%)
16.Poland: $16.6 million (0.6%)
17.Singapore: $16 million (0.6%)
18.South Africa: $14.2 million (0.5%)
19.Italy: $11.4 million (0.4%)
20.Türkiye: $11.4 million (0.4%)
Together, these 20 nations were responsible for a combined 94.5% of the world's black pepper exports in 2024.
Notable Export Growth Trends
Among these top players, the fastest year-over-year increases in export value were recorded by:
·Mexico: ↑ 352.5%
·Indonesia: ↑ 171.8%
·Singapore: ↑ 145.1%
·Cambodia: ↑ 131.6%
Conversely, countries with the smallest year-on-year gains included:
·United States: ↑ 0.4%
·Austria: ↑ 3.1%
·South Africa: ↑ 3.3%
Top Black Pepper Import Countries in 2024
In 2024, global imports of black pepper reached US$2.52 billion, a 56.9% jump from 2020's total of $1.6 billion. Compared to 2023’s figure of $1.9 billion, this marks a 31.8% annual increase.
The top 20 black pepper importing countries by dollar value in 2024 were:
1.United States: $540.5 million (21.5% of total imports)
2.India: $265.8 million (10.6%)
3.Vietnam: $166.2 million (6.6%)
4.Germany: $165.5 million (6.6%)
5.France: $84.9 million (3.4%)
6.United Kingdom: $73.1 million (2.9%)
7.Japan: $70.9 million (2.8%)
8.Netherlands: $63.3 million (2.5%)
9.Canada: $62 million (2.5%)
10.United Arab Emirates: $58.7 million (2.3%)
11.Mainland China: $55.7 million (2.2%)
12.South Korea: $50.1 million (2%)
13.Saudi Arabia: $48.5 million (1.9%)
14.Thailand: $45.3 million (1.8%)
15.Pakistan: $43.6 million (1.7%)
16.Poland: $43.2 million (1.7%)
17.Egypt: $42.1 million (1.7%)
18.Philippines: $35.5 million (1.4%)
19.Spain: $34.2 million (1.4%)
20.Italy: $31.9 million (1.3%)
Combined, these markets accounted for 78.7% of total global black pepper imports in 2024.
Top Import Growth Trends
The countries with the most significant increases in black pepper imports from 2023 were:
·Vietnam: ↑ 85.2%
·South Korea: ↑ 84.3%
·United States: ↑ 66%
·India: ↑ 63%
On the other hand, the only nation to experience a decline in import value was:
·United Arab Emirates: ↓ 28.9%
Trade Data: Tendata has accumulated 10 billion+ trade transaction details from 228+ countries and regions, supporting one-click query of major import and export countries, customer distribution, product volume and price, etc., which helps import and export enterprises to accurately understand the global market and the trade environment of the target market.
Business Data: Tendata has a total of 500 million+ in-depth enterprise data, involving 198 countries and 230+ industry segments, covering the current operation status, financial information, product information, business relationships, intellectual property rights, etc. The data is fine, which makes it easy to assess the real strength of the target customers in depth, and expand the potential customer base.
Internet Data: Tendata's total of 850 million+ contact data, integrating social media, emails and other multi-channel contacts, helps to reach key contacts of enterprises with one click and improve the efficiency of customer development, as well as news and public opinion monitoring, which helps to grasp the Internet information in a timely manner.

Category
Leave Message for Demo Request or Questions


 T-info
 T-discovery

 My
Tendata
 Market Analysis
 Customer
Development
 Competitor
Monitoring
 Customer Relationship


