 Trade Data
 2025-08-29
In 2024, worldwide shipments of nutmeg were valued at approximately US$218.3 million. This figure does not include mace, which is the reddish seed covering that surrounds the nutmeg kernel.
Compared to 2020, when sales stood at $199.4 million, global nutmeg exports have grown by an average of 9.5% over five years. However, on a year-to-year basis, exports dipped by -8.6% from $239 million in 2023.
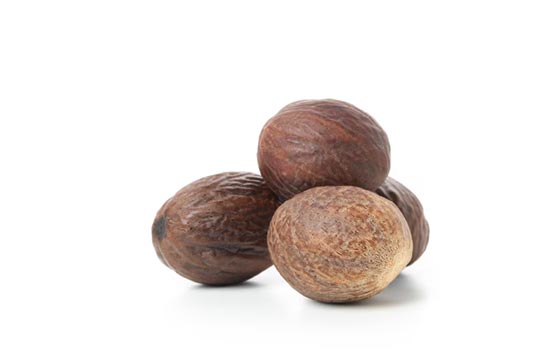
Nutmeg comes from the seed of an evergreen tree with dark leaves. Known for its sweet and warm flavor, nutmeg is widely used in soups, meat stews, sauces, potato dishes, rice puddings, mulled drinks, pumpkin pies, and baked squash. It also adds character to rum punch, jams, candies, essential oils, and even specialty butter.

Top Exporting Nations
By value, the five largest exporters—Indonesia, India, the Netherlands, Vietnam, and Sri Lanka—collectively accounted for about 85% of total nutmeg exports in 2024.
From a regional perspective:
·Asia dominated the global market, with nutmeg exports worth $173.9 million (79.7%).
·Europe ranked second, contributing 18.6%.
·North America supplied 1.4%, followed by smaller contributions from Latin America (0.2%), Africa (0.11%), and Oceania (0.06%), primarily Australia.
Top Importing Nations
Turning to buyers, the five leading import markets for nutmeg in 2024 were mainland China, Germany, the United States, the Netherlands, and Vietnam. Together, these countries purchased around 50.2% of all global imports.
This shows that while exports are concentrated among just 73 countries (with the top five suppliers dominating at 85%), imports are far more dispersed, spanning about 175 countries, islands, and territories.
By continent, demand for imported nutmeg broke down as follows:
·Asia led with 66.5% of global purchases.
·Europe followed at 19.4%.
·Latin America accounted for 5%,
·Africa purchased 4.9%,
·North America bought 3.9%,
·Oceania represented 0.2%, mainly Australia.
Nutmeg Export Classification
Under the Harmonized Tariff System (HS) codes:
·080911 covers non-crushed, whole nutmeg.
·080912 refers to ground or crushed nutmeg.
In 2024, about 71% of global exports were for whole nutmeg, while the remaining 29% came from ground or crushed nutmeg—up slightly from 28.7% in 2023.
Leading Nutmeg Exporters by Company
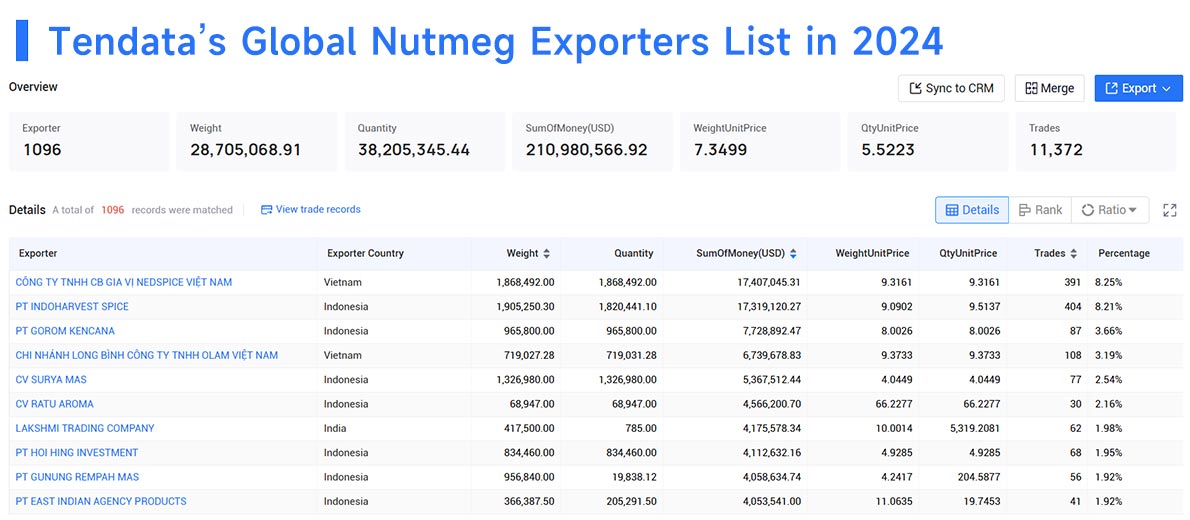
According to Tendata Global Trade data, the largest corporate suppliers of nutmeg in 2024 included:
1.CÔNG TY TNHH CB GIA VỊ NEDSPICE VIỆT NAM(8.25%, $17.41 Million)
2.PT INDOHARVEST SPICE(8.21%, $17.32 Million)
3.PT GOROM KENCANA(3.66%, $7.73 Million)
4.CHI NHÁNH LONG BÌNH CÔNG TY TNHH OLAM VIỆT NAM(3.19%, $6.74 Million)
5.CV SURYA MAS(2.54%, $5.37 Million)
6.CV RATU AROMA(2.16%, $4.57 Million)
7.LAKSHMI TRADING COMPANY(1.98%, $4.18 Million)
8.PT HOI HING INVESTMENT(1.95%, $4.11 Million)
9.PT GUNUNG REMPAH MAS(1.92%, $4.06 Million)
10.PT EAST INDIAN AGENCY PRODUCTS(1.92%, $4.05 Million)

Leading Nutmeg Importers by Company
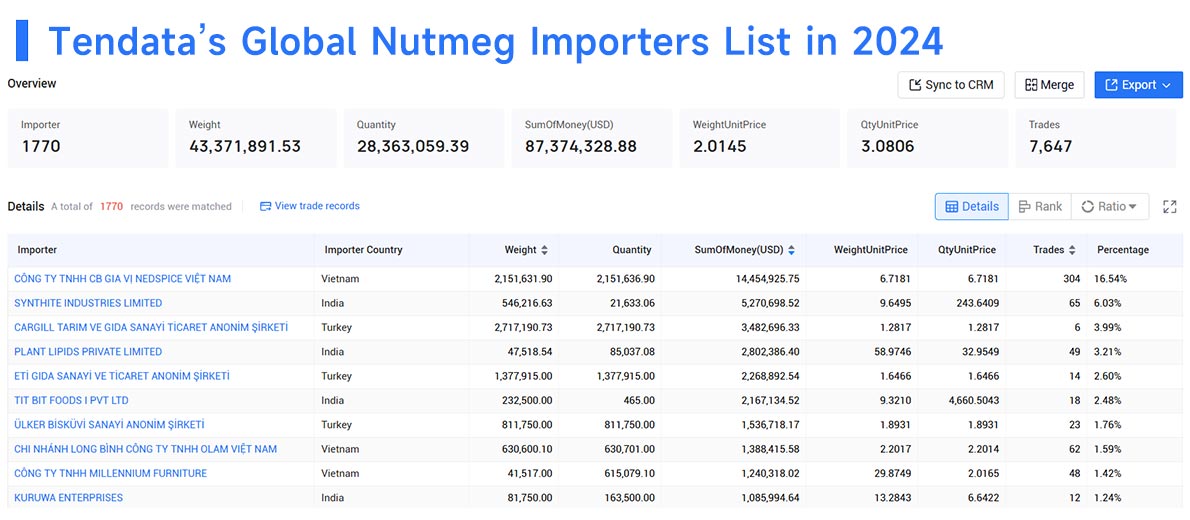
According to Tendata Global Trade data, the largest corporate buyers of nutmeg in 2024 included:
1.CÔNG TY TNHH CB GIA VỊ NEDSPICE VIỆT NAM(16.54%, $14.45 Million)
2.SYNTHITE INDUSTRIES LIMITED(6.03%, $5.27 Million)
3.CARGILL TARIM VE GIDA SANAYİ TİCARET ANONİM ŞİRKETİ(3.99%, $3.48 Million)
4.PLANT LIPIDS PRIVATE LIMITED(3.21%, $2.8 Million)
5.ETİ GIDA SANAYİ VE TİCARET ANONİM ŞİRKETİ(2.6%, $2.27 Million)
6.TIT BIT FOODS I PVT LTD(2.48%, $2.17 Million)
7.ÜLKER BİSKÜVİ SANAYİ ANONİM ŞİRKETİ(1.76%, $1.54 Million)
8.CHI NHÁNH LONG BÌNH CÔNG TY TNHH OLAM VIỆT NAM(1.59%, $1.39 Million)
9.CÔNG TY TNHH MILLENNIUM FURNITURE(1.42%, $1.24 Million)
10.KURUWA ENTERPRISES(1.24%, $1.09 Million)

Top Nutmeg Exporting Countries in 2024
The following list highlights the 20 leading exporters of nutmeg in 2024, covering both ground and whole nutmeg.
1.Indonesia: US$111.4 million (51% of global exports)
2.India: $30.9 million (14.2%)
3.Netherlands: $16.1 million (7.4%)
4.Vietnam: $14.7 million (6.7%)
5.Sri Lanka: $12.5 million (5.7%)
6.Germany: $6.8 million (3.1%)
7.Italy: $3.7 million (1.7%)
8.Belgium: $2.4 million (1.1%)
9.France: $2.3 million (1.1%)
10.Spain: $2.1 million (1%)
11.United States: $2.1 million (1%)
12.Austria: $2 million (0.9%)
13.Poland: $1.3 million (0.6%)
14.United Kingdom: $1 million (0.5%)
15.Malaysia: $916,000 (0.4%)
16.Singapore: $893,000 (0.4%)
17.Canada: $884,000 (0.4%)
18.Mainland China: $669,000 (0.3%)
19.Laos: $636,000 (0.3%)
20.Türkiye: $621,000 (0.3%)
Together, these 20 suppliers contributed nearly 98% of total nutmeg exports worldwide in 2024.
The most notable year-over-year growth came from the United Kingdom (+12.3%), Austria (+10.4%), France (+6.4%), and India (+5.9%).
In contrast, the steepest export declines were seen in Belgium (-35.6%), Vietnam (-28.3%), Germany (-20.7%), Canada (-20.6%), and mainland China (-14.1%).
Top Nutmeg Importing Countries in 2024
Global demand for nutmeg has grown by 16.5% since 2020, though there was a -1.1% dip from 2023.
Here are the 20 biggest import markets ranked by value:
1.Mainland China: US$45.9 million (20.7% of total imports)
2.Germany: $19.4 million (8.8%)
3.United States: $18.2 million (8.2%)
4.Netherlands: $14.4 million (6.5%)
5.Vietnam: $13.3 million (6%)
6.United Arab Emirates: $11.2 million (5.1%)
7.France: $8.2 million (3.7%)
8.India: $5.9 million (2.7%)
9.Italy: $5.8 million (2.6%)
10.United Kingdom: $5.5 million (2.5%)
11.Egypt: $4.9 million (2.2%)
12.Spain: $4.5 million (2%)
13.Japan: $4.2 million (1.9%)
14.Canada: $3.9 million (1.7%)
15.Belgium: $3.5 million (1.6%)
16.Argentina: $2.6 million (1.2%)
17.Pakistan: $2.58 million (1.2%)
18.Dominican Republic: $2.53 million (1.1%)
19.Austria: $2.52 million (1.1%)
20.Nigeria: $2.4 million (1.1%)
These 20 importers accounted for 81.9% of all nutmeg purchases worldwide in 2024.
The most impressive growth rates were posted by Nigeria (+3,986%), Egypt (+103.5%), Dominican Republic (+39.2%), and Pakistan (+16%).
On the downside, import declines were strongest in Belgium (-47.6%), Japan (-33.4%), Italy (-15%), Austria (-12.7%), and India (-12.6%).
Category
Leave Message for Demo Request or Questions


 T-info
 T-discovery

 My
Tendata
 Market Analysis
 Customer
Development
 Competitor
Monitoring
 Customer Relationship


