Tendata AI
  Exhibition
 B2B Platforms
 Standalone Website
 Social Media
 Emails
 Trade Data
 2026-07-24
Global hazelnut exports were valued at US$2.7 billion in 2025, reflecting continued global demand for one of the world's most popular tree nuts.
Compared with US$2.4 billion in 2021, the value of global hazelnut exports increased by 12.6% over the past five years. On a year-over-year basis, export revenues climbed 5.4%, rising from US$2.56 billion in 2024.
Also known as filberts or cobnuts, hazelnuts are harvested from hazel trees and are prized for their rich, buttery flavor and versatility in the food industry.
Hazelnuts are widely used in premium chocolate products, pralines, truffles, spreads, cakes, pastries, and other desserts. They are also processed into pastes, powders, flavorings, and ingredients for a wide range of bakery and confectionery applications.
Leading Hazelnut Exporting Countries
In 2025, the five largest exporters of hazelnuts by export value were Türkiye, Chile, the United States, Italy, and Azerbaijan. Together, these countries supplied 83.3% of all hazelnuts traded internationally, demonstrating the highly concentrated nature of global production and exports.
From a regional perspective, Asia remained the largest exporting region, shipping US$1.41 billion worth of hazelnuts and accounting for 52.2% of global export value. Europe ranked second with 19.3%, followed by Latin America (excluding Mexico but including the Caribbean) at 18.7%, North America (9.6%), Africa (0.06%), and Oceania (0.014%), represented primarily by Australia and New Zealand.
Largest Hazelnut Importing Countries
On the import side, Germany, Italy, France, Canada, and Poland were the world's five largest buyers of hazelnuts in 2025. Collectively, these markets accounted for 71.7% of total global hazelnut imports by value.
The distribution of global trade highlights a concentrated supplier base compared with a broader buyer network. Only 67 countries exported hazelnuts in 2025, while 152 countries and territories imported them. Although the top five exporters controlled 83.3% of global exports, the five largest importing countries represented a smaller 71.7% share of worldwide import value.
By continent, Europe dominated global hazelnut consumption, receiving 79.4% of all internationally traded hazelnuts. Asia accounted for 6.9% of imports, followed by North America (6.2%), Latin America (excluding Mexico but including the Caribbean) at 3.4%, Africa (3%), and Oceania (1.1%), led by Australia and New Zealand.
Average Export Prices for Hazelnuts
In 2025, the average export price for hazelnuts in shell reached US$4,782 per metric ton, representing a substantial 33.9% increase compared with the US$3,572 per ton recorded in 2024.
Shelled hazelnuts commanded significantly higher prices in international markets. The average export price climbed to US$9,861 per metric ton in 2025, up 18.9% from US$8,295 per ton the previous year. The higher value reflects the additional processing, labor, and production costs associated with removing the shells before export.
HS Codes for Hazelnuts
For customs and international trade purposes, hazelnuts are classified under two Harmonized System (HS) codes:
· HS Code 080221 – Fresh or dried hazelnuts in shell
· HS Code 080222 – Fresh or dried shelled hazelnuts
Shelled hazelnuts continued to dominate global trade in 2025, accounting for 91.7% of total export value. Although this remained the primary product category, its share declined slightly from 94.1% in 2024.
Meanwhile, exports of hazelnuts in shell increased their share of global trade to 8.3% in 2025, up from 5.9% a year earlier, indicating growing demand for less processed hazelnut products in certain international markets.

Top Hazelnuts Exports by Company
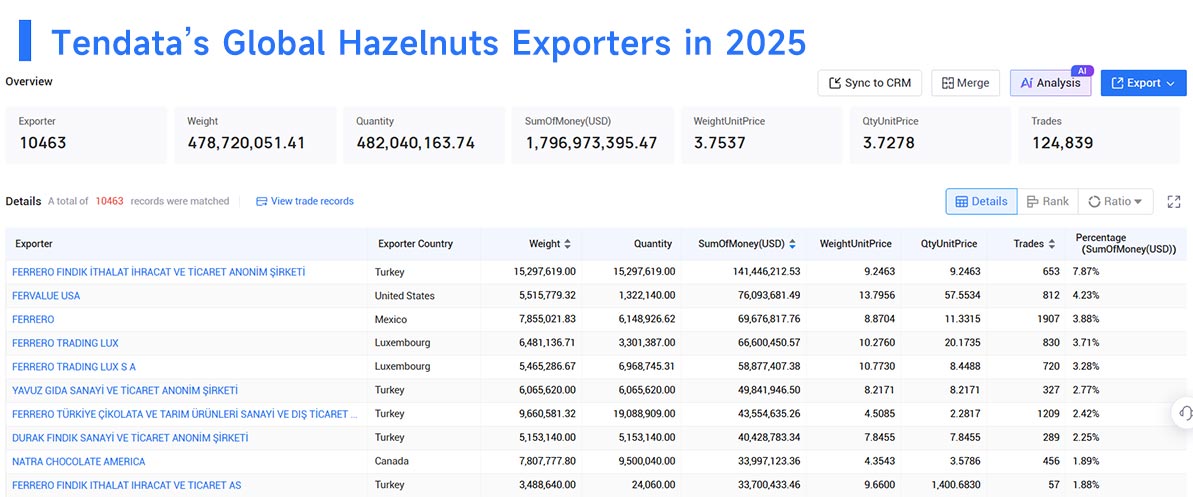
According to tendata export data,these are the main hazelnuts exporters in 2025: >>Find More Exporters via Tendata
1.FERRERO FINDIK İTHALAT İHRACAT VE TİCARET ANONİM ŞİRKETİ(7.87%, $141.45 Million)
2.FERVALUE USA(4.23%, $76.09 Million)
3.YAVUZ GIDA SANAYİ VE TİCARET ANONİM ŞİRKETİ(2.77%, $49.84 Million)
4.DURAK FINDIK SANAYİ VE TİCARET ANONİM ŞİRKETİ(2.25%, $40.43 Million)
5.NATRA CHOCOLATE AMERICA(1.89%, $34 Million)
6.OFİ TARIM SANAYİ VE TİCARET ANONİM ŞİRKETİ(1.7%, $30.52 Million)
7.FRUTICOLA AGRICHILE S A(1.42%, $25.46 Million)
8.İSTANBUL GIDA DIŞ TİCARET ANONİM ŞİRKETİ(1.05%, $18.79 Million)
9.STARWOOD ORMAN ÜRÜNLERİ SANAYİİ ANONİM ŞİRKETİ(1%, $18.04 Million)
10.WILHELM REUSS GMBH AND CO KG(0.92%, $16.6 Million)
Top Hazelnuts Imports by Company
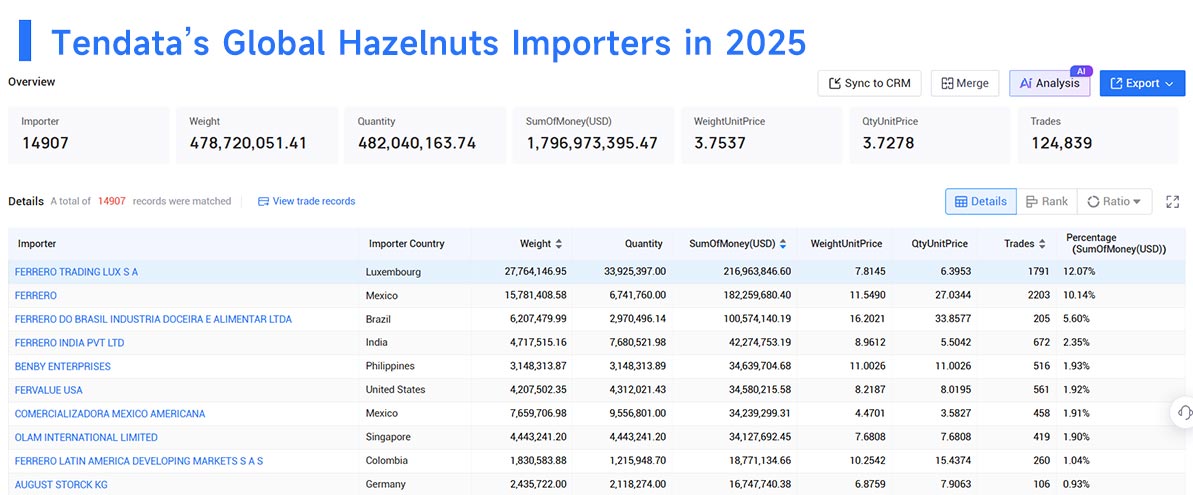
Based on tendata import data,these are the main hazelnuts importers in 2025: >>Find More Importers through Tendata
1.FERRERO TRADING LUX S A(12.07%, $216.96 Million)
2.BENBY ENTERPRISES(1.93%, $34.64 Million)
3.FERVALUE USA(1.92%, $34.58 Million)
4.COMERCIALIZADORA MEXICO AMERICANA(1.91%, $34.24 Million)
5.OLAM INTERNATIONAL LIMITED(1.9%, $34.13 Million)
6.AUGUST STORCK KG(0.93%, $16.75 Million)
7.ДП КК РОШЕН УКРАЇНА(0.69%, $12.32 Million)
8.KOBA COLOMBIA S A S(0.57%, $10.3 Million)
9.EURO TROUT GMBH(0.55%, $9.87 Million)
10.ООО РИТТЕР СПОРТ ШОКОЛАД(0.51%, $9.24 Million)
Top Hazelnut Exporters by Country in 2025
The following countries generated the highest export revenues from hazelnuts in 2025, including both in-shell and shelled products.
1. Türkiye — US$1.1 billion (39.5% of global exports)
2. Chile — US$505 million (18.7%)
3. United States — US$259.2 million (9.6%)
4. Italy — US$249.3 million (9.2%)
5. Azerbaijan — US$170.7 million (6.3%)
6. Georgia — US$164.9 million (6.1%)
7. Netherlands — US$64.7 million (2.4%)
8. Spain — US$64.5 million (2.4%)
9. Germany — US$38.8 million (1.4%)
10. France — US$23.1 million (0.9%)
11. Poland — US$14.5 million (0.5%)
12. Czech Republic — US$12.7 million (0.5%)
13. Serbia — US$8.7 million (0.3%)
14. Bulgaria — US$7.1 million (0.3%)
15. Croatia — US$6.6 million (0.2%)
16. Austria — US$4.7 million (0.2%)
17. Slovakia — US$4.7 million (0.2%)
18. Lithuania — US$3.7 million (0.1%)
19. Mainland China — US$3.6 million (0.1%)
20. Belgium — US$3.5 million (0.1%)
These 20 countries collectively supplied 99.1% of the world's hazelnut exports in 2025, underscoring the highly concentrated structure of the global export market.
Among the leading exporters, Mainland China recorded the strongest year-over-year growth, with export value soaring 421.8%. Other standout performers included Croatia (+251.5%), Chile (+113.1%), and Poland (+94.5%), all of which achieved significant export gains during the year.
Only two of the top 20 exporters experienced declining export sales. Türkiye, despite remaining the world's largest supplier, saw exports fall 29.3% compared with 2024, while France reported a more moderate decline of 11.1%.
Top Hazelnut Importers by Country in 2025
Global spending on imported hazelnuts reached US$2.6 billion in 2025. Compared with 2021, worldwide import value increased 17.4%, while year-over-year imports expanded 15.7% from 2024, reflecting continued growth in international demand.
The largest hazelnut importing countries in 2025 were:
1. Germany — US$794.5 million (30.5% of global imports)
2. Italy — US$552.8 million (21.2%)
3. France — US$237 million (9.1%)
4. Canada — US$165.8 million (6.4%)
5. Poland — US$114.7 million (4.4%)
6. Brazil — US$88.1 million (3.4%)
7. Russia — US$87.8 million (3.4%)
8. Switzerland — US$86.1 million (3.3%)
9. Spain — US$67 million (2.6%)
10. Netherlands — US$51.8 million (2%)
11. Algeria — US$49 million (1.9%)
12. Mainland China — US$46.2 million (1.8%)
13. Austria — US$30.7 million (1.2%)
14. Australia — US$28.4 million (1.1%)
15. Belgium — US$26.2 million (1%)
16. Türkiye — US$25.5 million (1%)
17. United Kingdom — US$21.7 million (0.8%)
18. Czech Republic — US$18.2 million (0.7%)
19. Greece — US$17.6 million (0.7%)
20. Syria — US$16.6 million (0.6%)
Together, these 20 markets accounted for 97.1% of the total value of hazelnut imports worldwide in 2025.
Among the major importing countries, Syria posted the fastest growth, with imports increasing an impressive 510.7% from the previous year. Poland also recorded exceptional growth of 161.5%, followed by Türkiye (+81.4%) and Mainland China (+32.2%).
Several countries reported lower import values compared with 2024. Algeria experienced the largest decline at 12.3%, while Russia (-4.8%), Canada (-4%), and the United Kingdom (-4%) also recorded modest decreases in hazelnut imports during the year.
Category
Leave Message for Demo Request or Questions