 Trade Data
 2023-11-03
China's exports up 5.05% to $ billion in September vs August.

The latest Tendata iTrader data shows that China's top 10 exports in September 2023, based on 2-digit HS codes, were:
1.Mechanical & Electrical Products (27.85%, $179.09 Billion)
2.Machinery & Transport Equipment(23.37%, $150.26 Billion)
3.High-&-new-tech Products(12.68%, $81.53 Billion)
4.Automatic Data Proc. Eq. & Components(2.71%, $17.45 Billion)
5.Mobile Telephone(2.49%, $15.98 Billion)
6.Handled Wireless Phone and Its Parts(2.49%, $15.98 Billion)
7.Integrated Circuit(2.1%, $13.5 Billion)
8.Digital Automatic Data Proc. Equip.(1.48%, $9.53 Billion)
9.Motor Vehicles & Chassis(1.43%, $9.19 Billion)
10.Plastic Products(1.36%, $8.73 Billion)
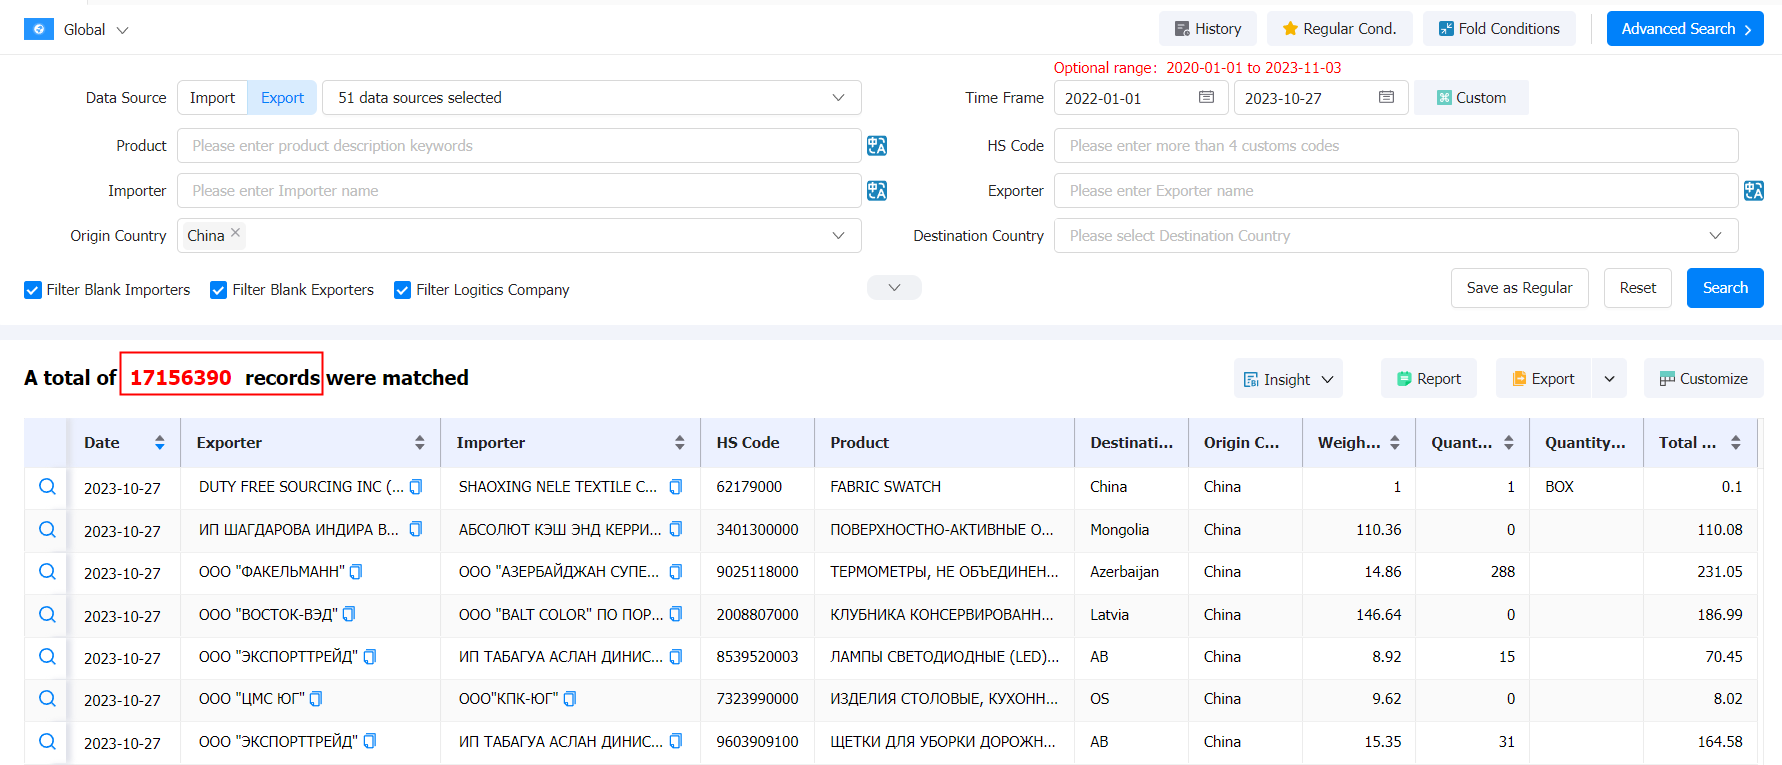
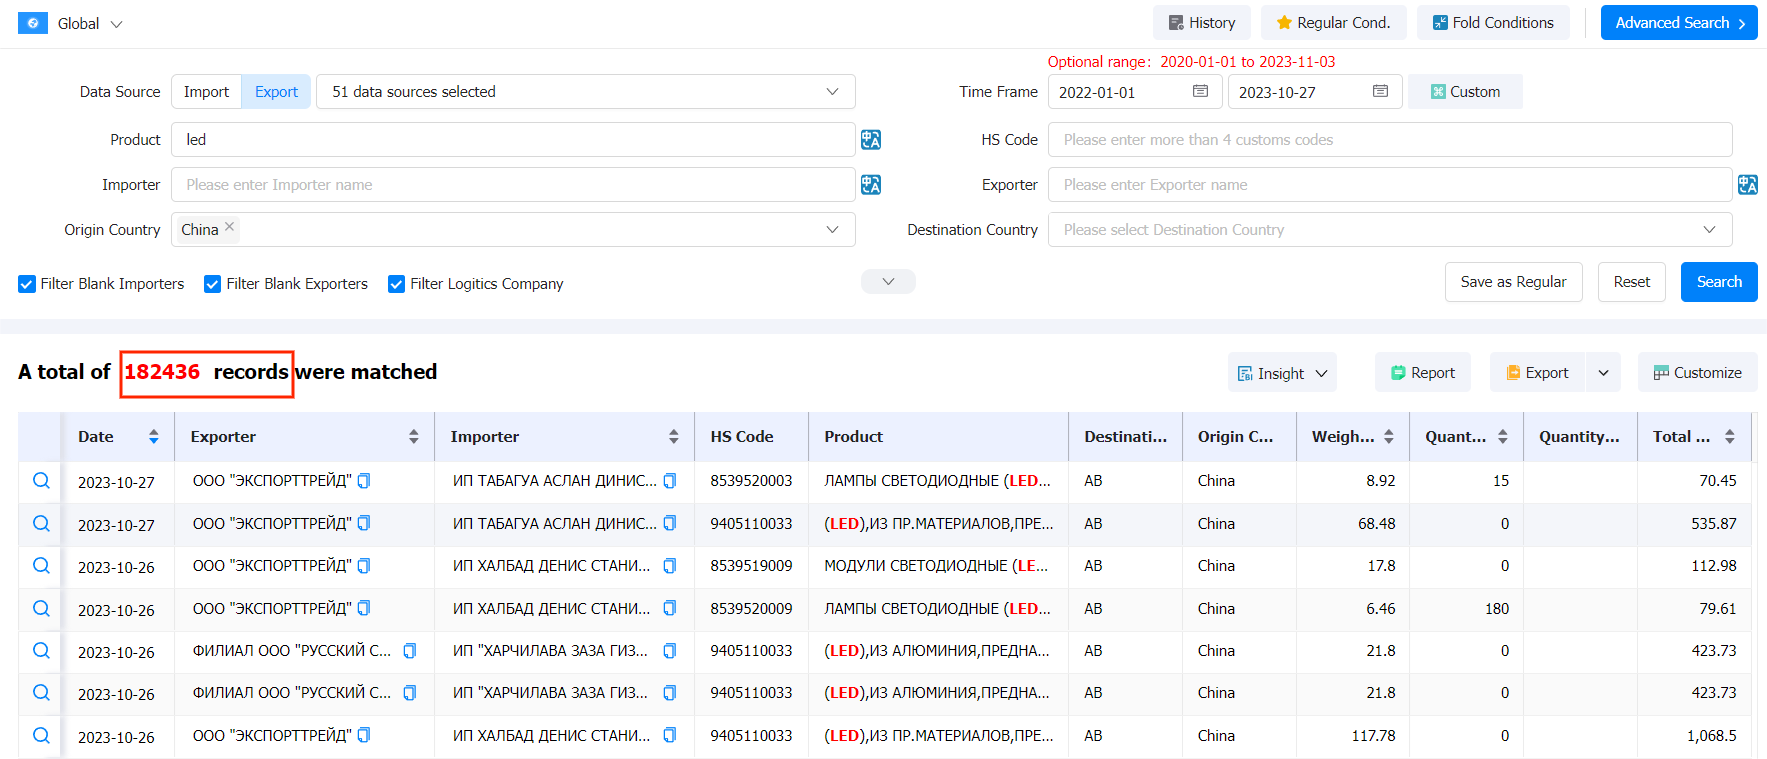
When you need to understand the market in China, you can search Tendata's China Import Database using either the product name or the 2-digit HS code to get market trends across the industry. With these China Import Databases, you can quickly analyze the market. Below is a sample of the search for you (data as of October 2023):

The latest Tendata iTrader data shows that China's main export partners are:
1.United States (17.77%, $46.02 Billion)
2.Hong Kong(10.64%, $27.56 Billion)
3. Japan(5.51%, $14.27 Billion)
4. Vietnam(4.79%, $12.41 Billion)
5. India(4.38%, $11.33 Billion)
6. Russia(3.72%, $9.65 Billion)
7. Netherlands(3.24%, $8.39 Billion)
8.Germany(3.17%, $8.2 Billion)
9.United Kingdom(2.88%, $7.45 Billion)
10.Malaysia(2.84%, $7.35 Billion)
When you want to see if Chinese exporters tend to work with importers in your country, you can look in Tendata's China Import Database by country name. Don't forget to select the timeframe to get the latest import and export data.
Category
Leave Message for Demo Request or Questions


 T-info
 T-discovery

 My
Tendata
 Market Analysis
 Customer
Development
 Competitor
Monitoring
 Customer Relationship


