 Trade Data
 2024-02-27
The United States is the world's second largest importer.
Major U.S. imports are consumer goods (27 %), capital goods (26 %), and industrial supplies (25 %), followed by automobiles, parts, and engines (12 %) and food, feed, and beverages (6 %). Shipments from China accounted for 17% of total imports, followed by Mexico (14%), Canada (13%), Japan (4.5%) and Germany (4.5%).
The latest Tendata iTrader data shows that the Top 10 U.S. imports in 2023, based on 2-digit HS codes, are:
1. Electrical, electronic equipment(14.62%, $463.36 Billion)
2. Machinery, nuclear reactors, boilers(14.49%, $459.2 Billion)
3. Vehicles other than railway, tramway(12.03%, $381.04 Billion)
4. Mineral fuels, oils, distillation products(8.41%, $266.59 Billion)
5. Pharmaceutical products(5.61%, $177.85 Billion)
6. Commodities not specified according to kind(3.94%, $124.98 Billion)
7. Optical, photo, technical, medical apparatus(3.73%, $118.32 Billion)
8. Pearls, precious stones, metals, coins(2.7%, $85.49 Billion)
9. Plastics(2.28%, $72.35 Billion)
10. Furniture, lighting signs, prefabricated buildings(2.18%, $69.01 Billion)
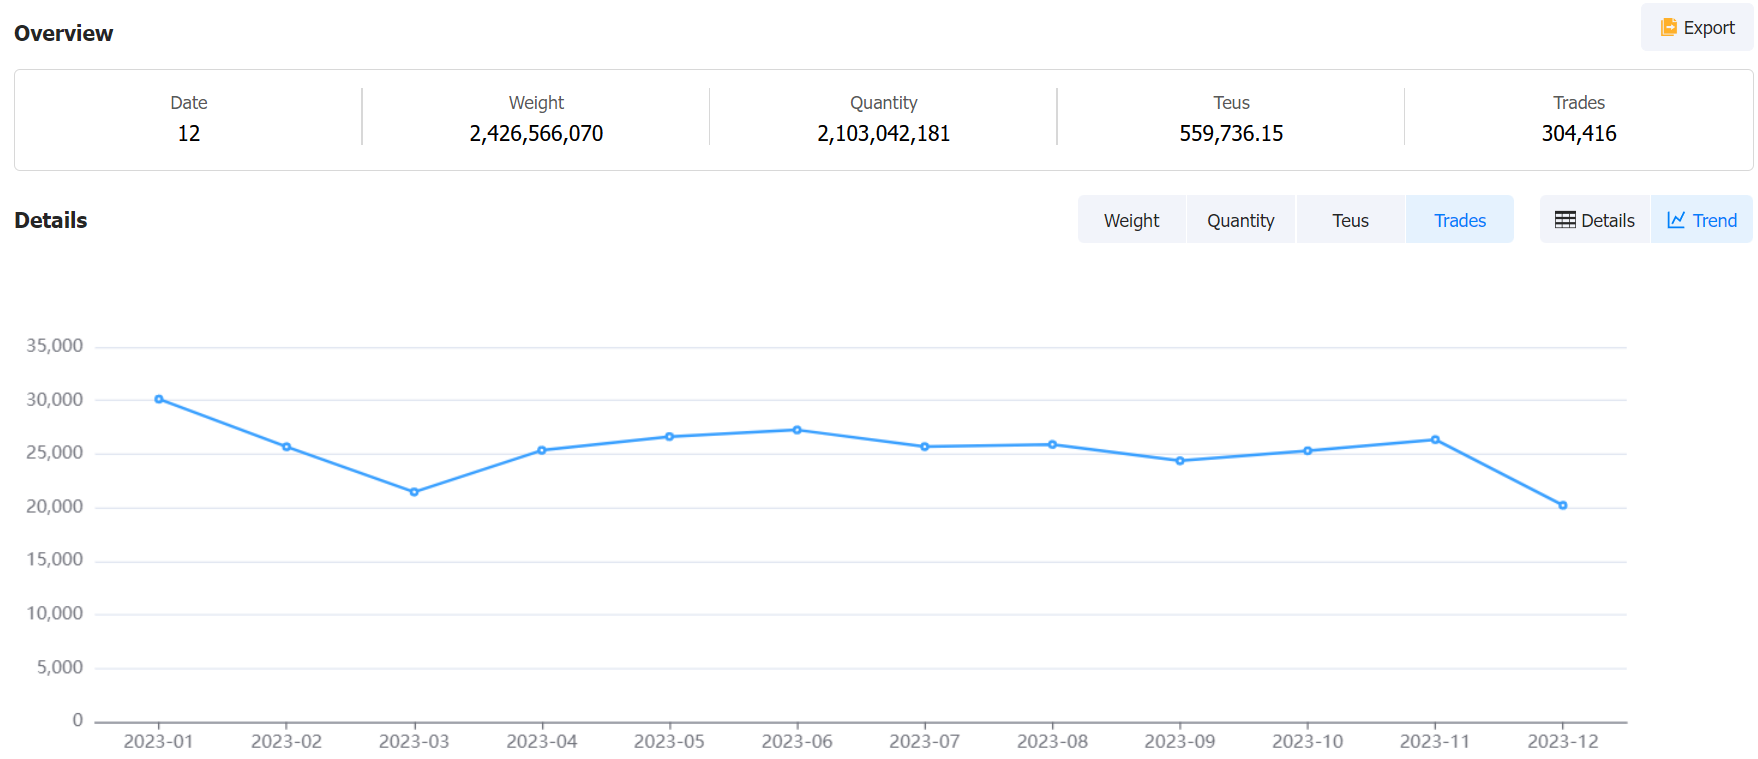
When you need to understand the US market, you can search Tendata's us imports data using either the product name or the HS code to get market trends across the industry. Of course, in addition to the above, Tendata also supports searching by importer name, importer address, port of origin, port of destination, bill of lading number, weight, quantity, number of containers, dimensions, and so on. You can see that all fields in us imports data have this data. With this us imports data you can quickly analyze the market.
Here is a sample of the search for you (data as of February 2023):

The latest Tendata iTrader data shows that the major import partners of the US are:
1. Mexico(15.59%, $480.05 Billion)
2. China(14.55%, $448.02 Billion)
3. Canada(13.96%, $429.6 Billion)
4. Germany(5.29%, $162.96 Billion)
5. Japan(4.92%, $151.58 Billion)
6. South Korea(3.89%, $119.72 Billion)
7. Vietnam(3.86%, $118.94 Billion)
8. India(2.84%, $87.28 Billion)
9. Ireland(2.69%, $82.71 Billion)
10. Italy(2.44%, $75.17 Billion)
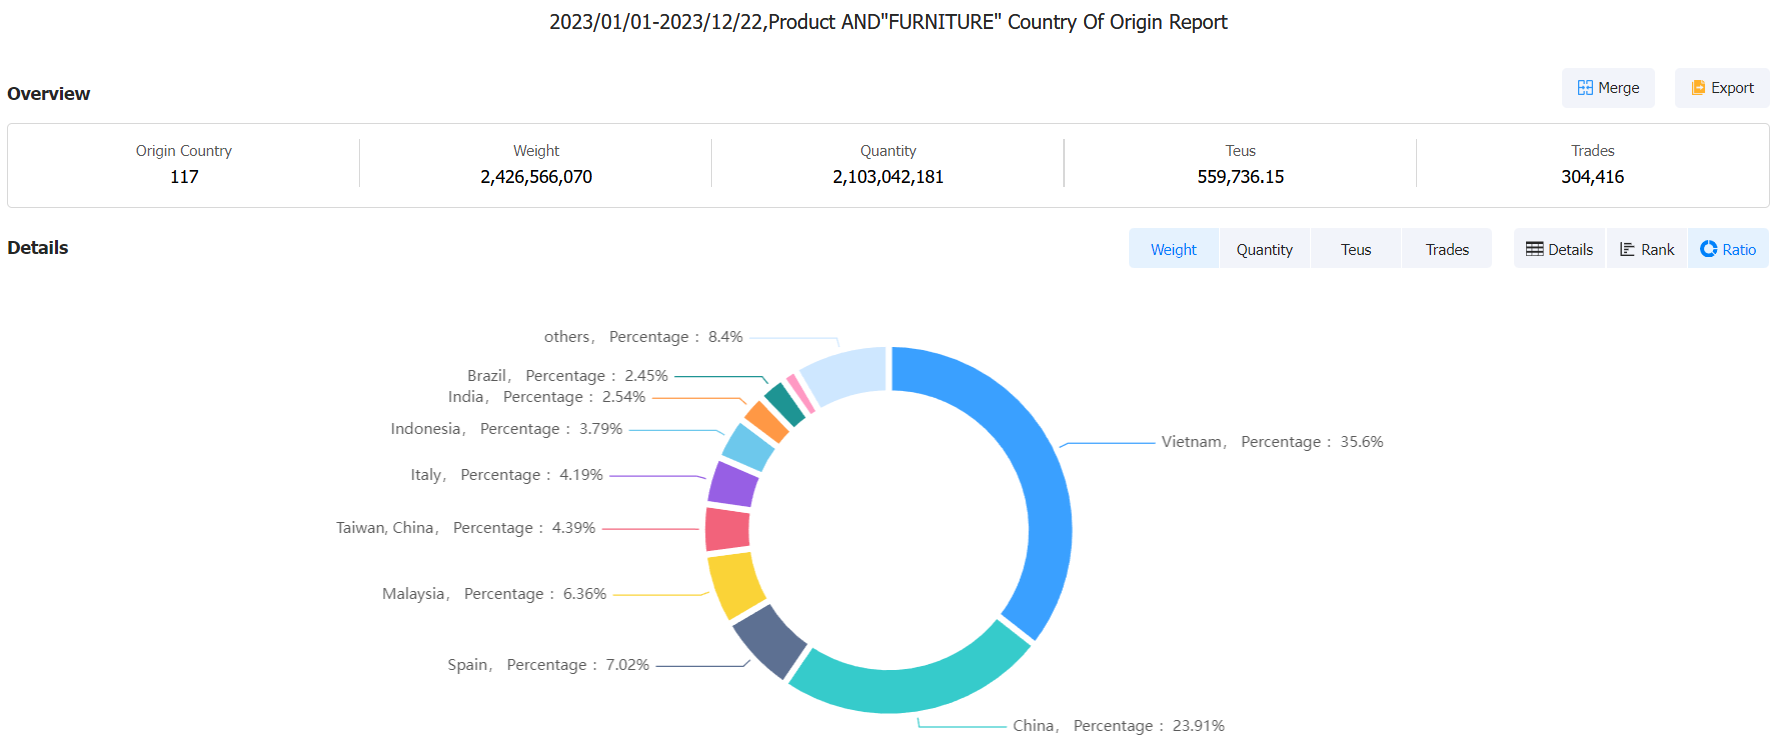
When you want to see if US importers prefer to work with exporters from your country, you can look in Tendata's us imports data by country name. Don't forget to select the timeframe to get the latest import/export data.
Below is a sample of the search for you (data as of February 2023):

Expand your US imports business with customs data and appropriate market intelligence.
Our U.S. trade data covers company, product and other detailed customs information. Every shipment detail for U.S. imports is useful to the entire industry. From importers and exporters to logistics companies and others, U.S. import data adds value to every business.
Category
Leave Message for Demo Request or Questions


 T-info
 T-discovery

 My
Tendata
 Market Analysis
 Customer
Development
 Competitor
Monitoring
 Customer Relationship


