 Trade Data
 2025-04-15
In 2023, international trade in fresh peaches—including nectarines—reached a combined value of approximately $2.33 billion USD.
Unless otherwise noted, all references to "peaches" include both peaches and nectarines, which are botanically the same fruit but marketed differently. The main distinction lies in their skin: peaches are fuzzy, while nectarines have a smooth surface.
Compared to 2019, global exports of fresh peaches rose by 5.8%, up from $2.2 billion. However, year-over-year figures show a 6% decline from the $2.47 billion recorded in 2022.
Top Exporting Nations
The five largest peach exporters in 2023—Spain, Türkiye, the United States, Chile, and Italy—collectively accounted for 67.4% of the world's peach exports by dollar value.
On a regional basis, Europe dominated peach exports with shipments valued at $1.35 billion, representing 58.2% of the global total. This was followed by exporters in Asia (23.3%), North America (6.3%), Latin America (excluding Mexico but including the Caribbean) at 6.2%, Africa (4.1%), and Oceania (1.9%), with Australia being the main contributor.
Key Importing Markets
The leading peach importers in 2023 were Germany, Russia, France, Italy, and the United Kingdom, which together purchased 45.6% of total global imports.
While there are 88 nations exporting peaches (with the top five making up 67.4% of the total), roughly 170 countries, territories, and islands are importers. This indicates that peach export activity is more centralized compared to import distribution.
Looking at regional demand, Europe was by far the largest importer, absorbing 71.5% of all internationally traded peaches. This was followed by Asia (16.7%), North America (9.2%), Latin America (1.4%), Africa (1.1%), and Oceania (0.1%), led by Australia.
In terms of pricing, the global average import cost per ton of peaches was $1,587 in 2023—an increase of 3.1% from the previous year's average of $1,539.
For classification purposes, the Harmonized Tariff System (HTS) code for fresh peaches, including nectarines, is 080930.

Top Peaches Exports by Company in 2024
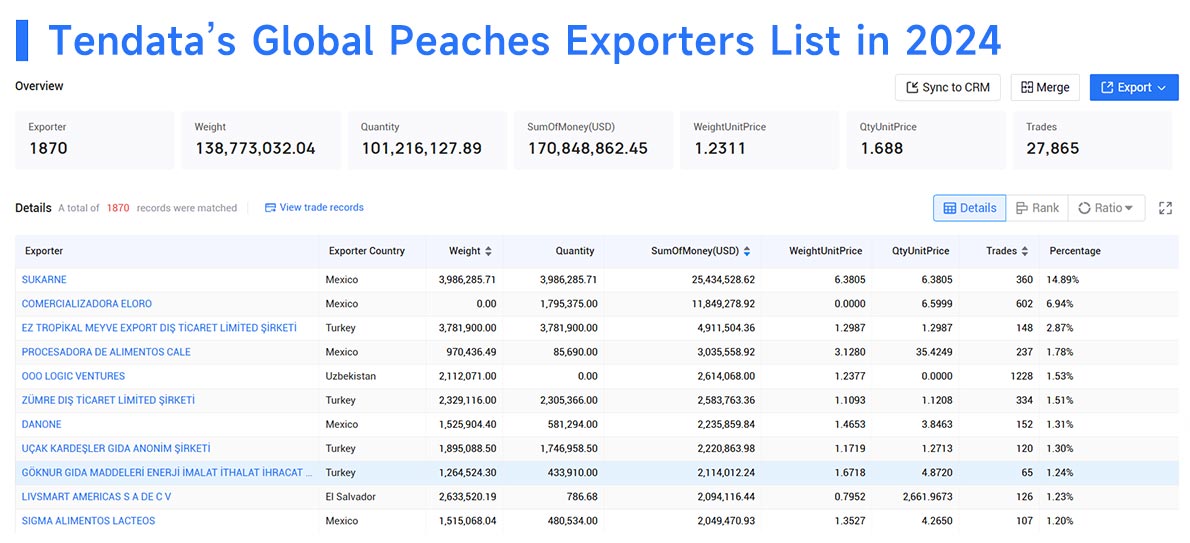
According to Tendata, the following 10 companies are expected to be the top 10 peach exporters in the world by 2024:
1.SUKARNE(14.89%, $25.43 Million)
2.COMERCIALIZADORA ELORO(6.94%, $11.85 Million)
3.EZ TROPİKAL MEYVE EXPORT DIŞ TİCARET LİMİTED ŞİRKETİ(2.87%, $4.91 Million)
4.PROCESADORA DE ALIMENTOS CALE(1.78%, $3.04 Million)
5.ООО LOGIC VENTURES(1.53%, $2.61 Million)
6.ZÜMRE DIŞ TİCARET LİMİTED ŞİRKETİ(1.51%, $2.58 Million)
7.DANONE(1.31%, $2.24 Million)
8.UÇAK KARDEŞLER GIDA ANONİM ŞİRKETİ(1.3%, $2.22 Million)
9.GÖKNUR GIDA MADDELERİ ENERJİ İMALAT İTHALAT İHRACAT TİCARET VE SANAYİ ANONİM ŞİRKETİ(1.24%, $2.11 Million)
10.LIVSMART AMERICAS S A DE C V(1.23%, $2.09 Million)

Top Peaches Imports by Company in 2024
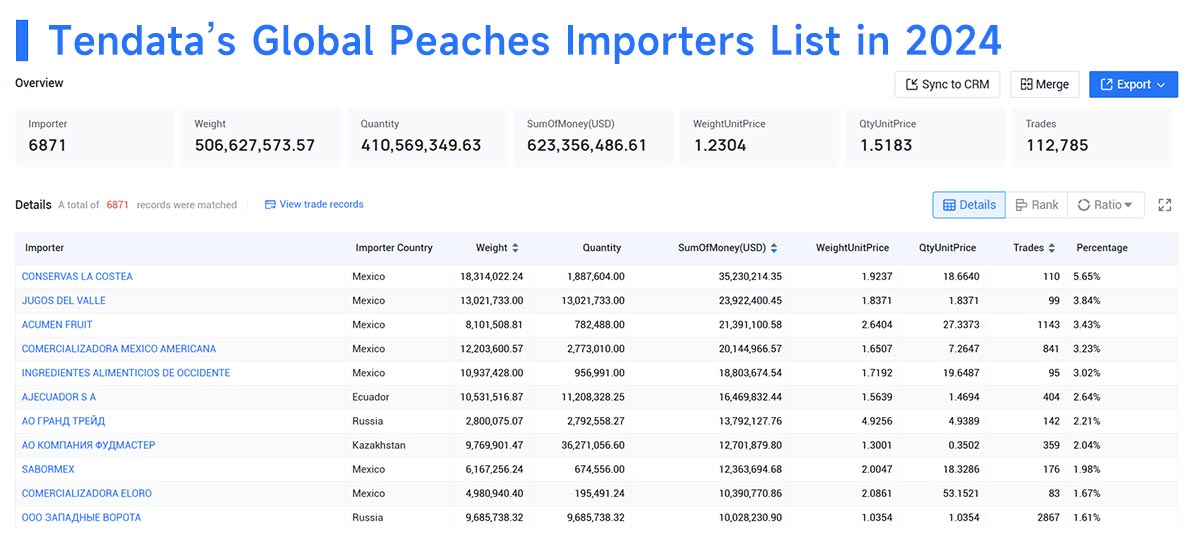
According to Tendata, the following 10 companies are expected to be the top 10 peach importers in the world by 2024:
1.CONSERVAS LA COSTEA(5.65%, $35.23 Million)
2.JUGOS DEL VALLE(3.84%, $23.92 Million)
3.ACUMEN FRUIT(3.43%, $21.39 Million)
4.COMERCIALIZADORA MEXICO AMERICANA(3.23%, $20.14 Million)
5.INGREDIENTES ALIMENTICIOS DE OCCIDENTE(3.02%, $18.8 Million)
6.AJECUADOR S A(2.64%, $16.47 Million)
7.АО ГРАНД ТРЕЙД(2.21%, $13.79 Million)
8.АО КОМПАНИЯ ФУДМАСТЕР(2.04%, $12.7 Million)
9.SABORMEX(1.98%, $12.36 Million)
10.COMERCIALIZADORA ELORO(1.67%, $10.39 Million)

Top Peach Exporters in 2023 (by Export Value)
1.Spain – $949.6 million (40.8%)
2.Türkiye – $202.6 million (8.7%)
3.United States – $145.6 million (6.3%)
4.Chile – $142.5 million (6.1%)
5.Italy – $127.6 million (5.5%)
6.Greece – $101 million (4.3%)
7.Jordan – $90.3 million (3.9%)
8.China (mainland) – $77.4 million (3.3%)
9.France – $65.9 million (2.8%)
10.South Africa – $51.7 million (2.2%)
11.Azerbaijan – $51.4 million (2.2%)
12.Hong Kong – $50.9 million (2.2%)
13.Australia – $44.5 million (1.9%)
14.Netherlands – $43.5 million (1.9%)
15.Egypt – $25 million (1.1%)
16.Georgia – $24.7 million (1.1%)
17.Japan – $18.6 million (0.8%)
18.Tunisia – $12.2 million (0.5%)
19.Germany – $12 million (0.5%)
20.Serbia – $10.4 million (0.4%)
These top 20 countries were responsible for 96.6% of the world's peach exports in 2023.
Countries that recorded the fastest export growth since 2022 included:
·Azerbaijan (+56.6%)
·Jordan (+35.5%)
·Netherlands (+17.6%)
·Australia (+17.4%)
On the other hand, some exporters saw significant decreases:
·Italy (-37.9%)
·Serbia (-27.4%)
·Georgia (-18.8%)
·Japan (-16.1%)
·China (mainland) (-13.2%)
Top Peach Importers in 2023 (by Import Value)
1.Germany – $425.1 million (16.6%)
2.Russia – $247.4 million (9.6%)
3.France – $206.4 million (8%)
4.Italy – $149.4 million (5.8%)
5.United Kingdom – $142 million (5.5%)
6.China (mainland) – $100.9 million (3.9%)
7.Canada – $83.9 million (3.3%)
8.United States – $83.5 million (3.3%)
9.Netherlands – $82.5 million (3.2%)
10.Hong Kong – $76.4 million (3%)
11.Mexico – $67.8 million (2.6%)
12.Switzerland – $65.5 million (2.6%)
13.Belgium – $62.1 million (2.4%)
14.Romania – $55.6 million (2.2%)
15.Austria – $53.6 million (2.1%)
16.Saudi Arabia – $53.2 million (2.1%)
17.Portugal – $47.5 million (1.9%)
18.Taiwan – $38.9 million (1.5%)
19.Ukraine – $36.8 million (1.4%)
20.Czech Republic – $34.2 million (1.3%)
Altogether, these 20 countries imported 82.4% of all peaches traded globally in 2023.
The most significant year-over-year import growth came from:
·Saudi Arabia (+109.4%)
·Austria (+50.7%)
·Italy (+47.2%)
·Ukraine (+43.7%)
Countries with declining import figures included:
·Russia (-29.7%)
·Taiwan (-17.8%)
·Portugal (-7.7%)
·Hong Kong (-5%)
·United States (-4.6%)
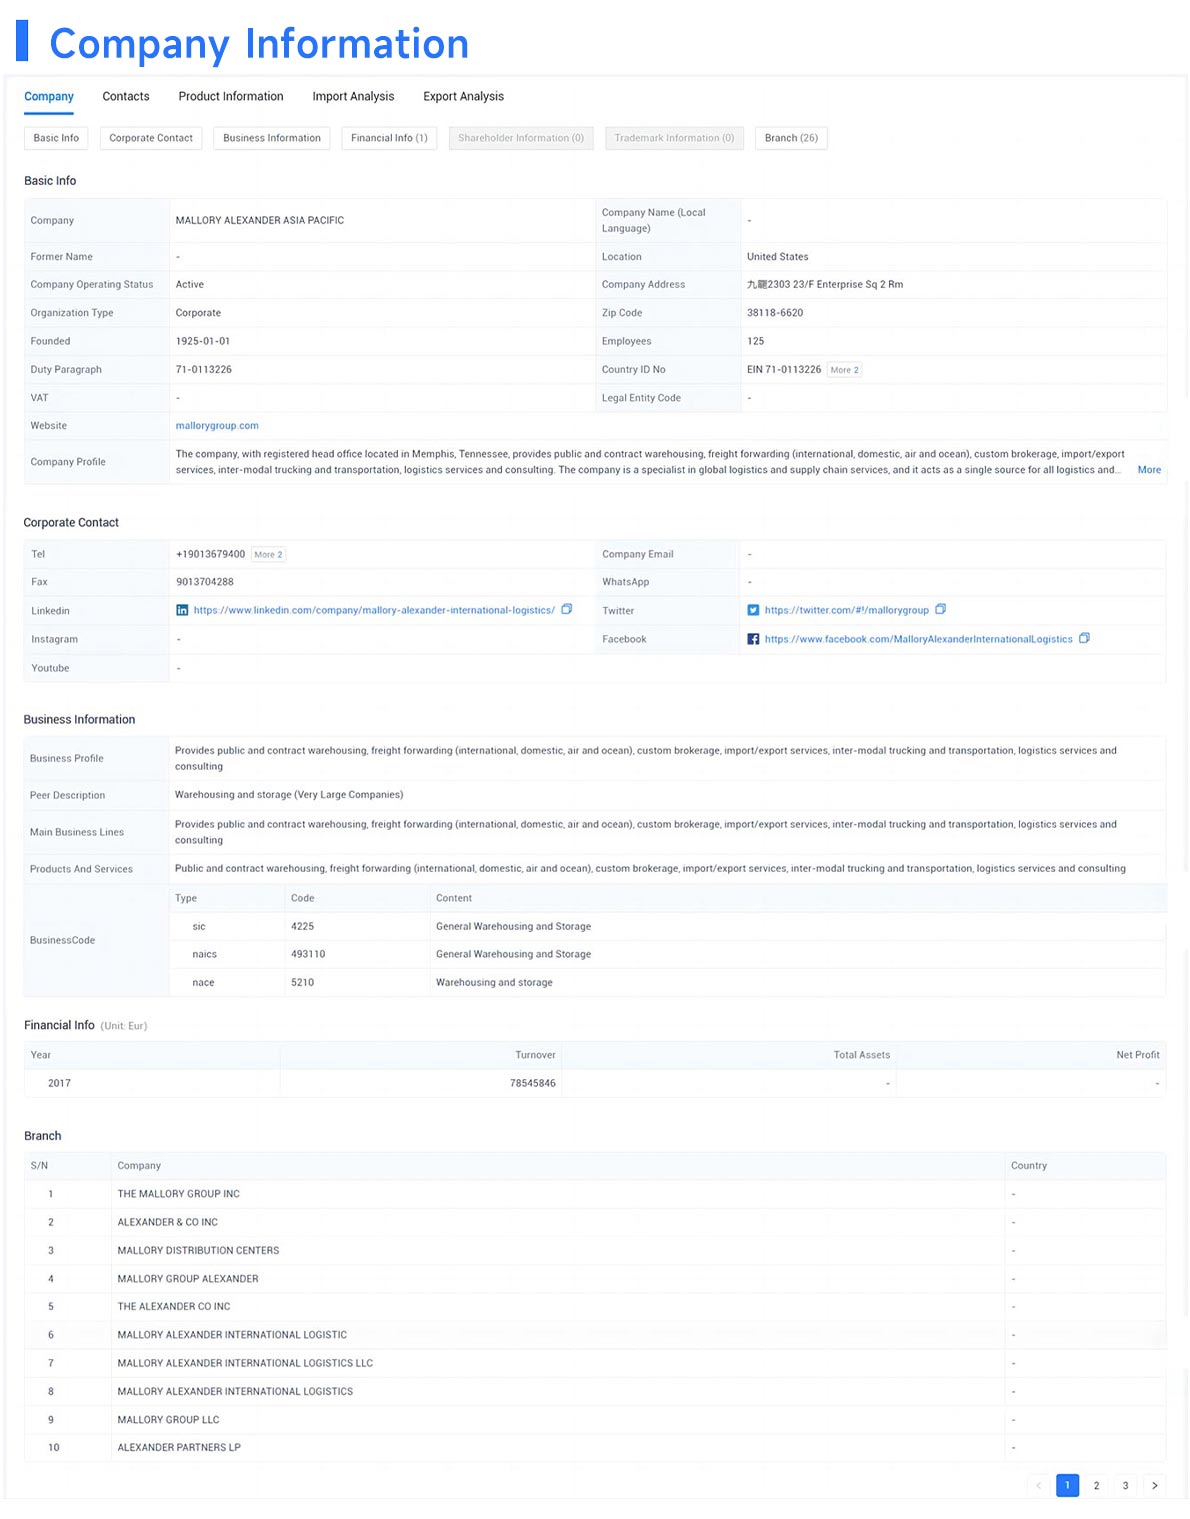
Tendata provides 850 million+ contact information for 500 million companies
in 228+ countries around the world, including phone number, email, LinkedIn, Facebook,
Instagram, Twitter, Youtube and other contact information. These contact
information are verified to ensure that you can contact customers.
In addition, Tendata also provides basic information about companies, including branches, equity relationships, main products, business relationships, news and public opinion, intellectual property rights, etc. You can use this information to conduct background checks on companies.
Tendata also provides import or export analysis of companies, including trade trends, product HS codes, supply chain information, country of origin or country of supplier, ports, etc. You can track the latest developments of companies and find out if they have the latest needs.
We show you Tendata's corporate information cases: >>Request for Free Demo

Category
Leave Message for Demo Request or Questions


 T-info
 T-discovery

 My
Tendata
 Market Analysis
 Customer
Development
 Competitor
Monitoring
 Customer Relationship


