 Trade Data
 2025-04-27
In 2023, the global export value for cardamoms totaled approximately US$799.7 million.
Compared to five years earlier in 2019, when sales reached $1 billion, cardamom exports have declined by an average of -20.8%.
From 2022 to 2023 alone, the total revenue generated from cardamom exports dropped by -10.4%, down from $892.7 million.
Cardamom, known for its strong and distinctive flavor, is widely utilized in both sweet and savory dishes across Asia. It also enhances the taste of coffee, teas, baked goods, chewing gum, curry pastes, and alcoholic beverages such as gin and bitters.
Guatemala, situated in Central America just south of Mexico and near the Caribbean Sea, stands out as a major player in cardamom exports.
In 2023, the five largest exporters of cardamoms — Guatemala, India, the United Arab Emirates, Nepal, and Indonesia — were responsible for 87.2% of the total worldwide shipments.
From a regional perspective, Asian countries dominated the global cardamom export market, contributing $404.6 million or 50.6% of the total value. Latin America, mainly Guatemala, followed with 45.5%, trailed by Europe (3.4%), Africa (0.2%), North America (0.2%), and Oceania (0.02%), mainly represented by Australia.
Turning to imports, Saudi Arabia, the United Arab Emirates, India, mainland China, and Bangladesh emerged as the top five cardamom importers in 2023, accounting for a combined 59.3% of all imported cardamoms by dollar value.
These figures indicate that the cardamom export market is more consolidated among 83 countries (with the top five covering 87.2% of exports) compared to the import market spread across 154 countries, islands, and territories.
When broken down by continent, Asia led global cardamom imports with 85.2% of purchases, far ahead of Africa and Europe (each at 5.4%), followed by North America (3%), Oceania (0.5%), and Latin America (0.4%).
For customs classification, the Harmonized Tariff System codes are 090831 for unprocessed cardamoms and 090832 for crushed or ground cardamoms.
In 2023, about 93.6% of cardamom export value was for whole, unprocessed cardamoms, with the remaining 6.4% attributed to crushed or ground varieties — a slight rise compared to the previous year.

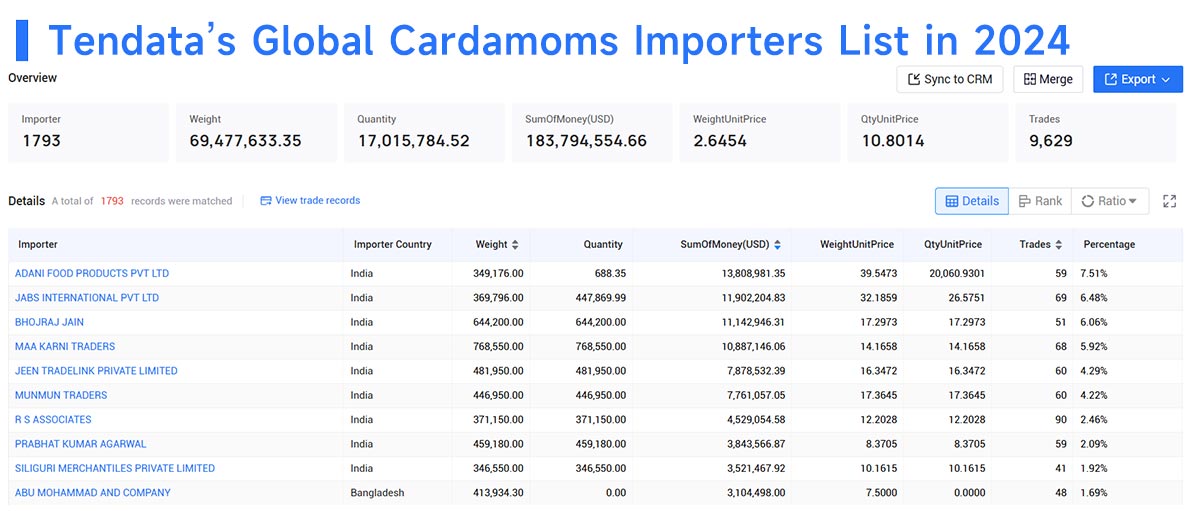
Top Cardamoms Imports by Company in 2024
1.ADANI FOOD PRODUCTS PVT LTD(7.51%, $13.81 Million)
2.JABS INTERNATIONAL PVT LTD(6.48%, $11.9 Million)
3.BHOJRAJ JAIN(6.06%, $11.14 Million)
4.MAA KARNI TRADERS(5.92%, $10.89 Million)
5.JEEN TRADELINK PRIVATE LIMITED(4.29%, $7.88 Million)
6.MUNMUN TRADERS(4.22%, $7.76 Million)
7.R S ASSOCIATES(2.46%, $4.53 Million)
8.PRABHAT KUMAR AGARWAL(2.09%, $3.84 Million)
9.SILIGURI MERCHANTILES PRIVATE LIMITED(1.92%, $3.52 Million)
10.ABU MOHAMMAD AND COMPANY(1.69%, $3.1 Million)

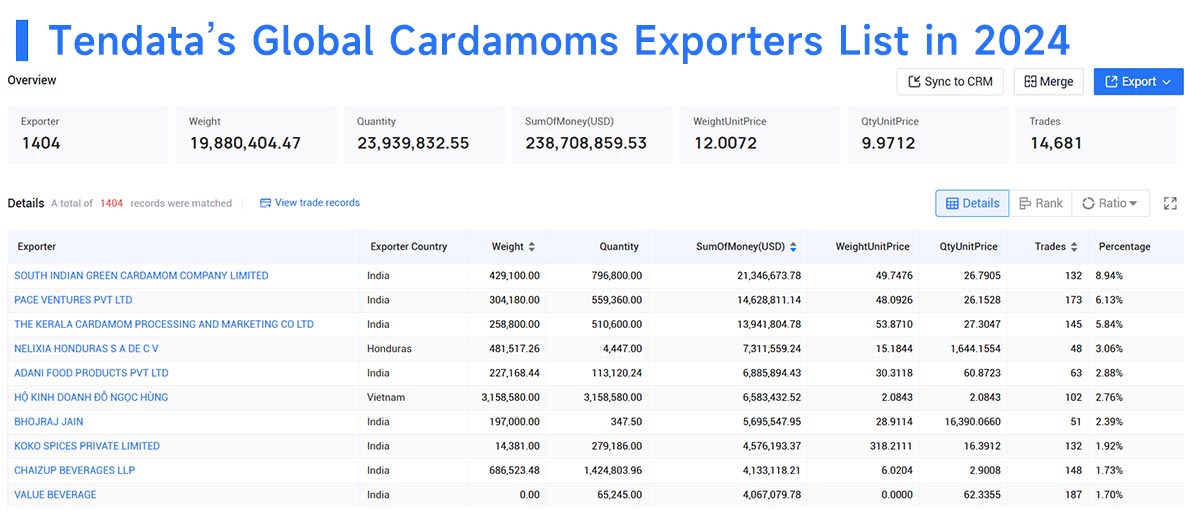
Top Cardamoms EXports by Company in 2024
1.SOUTH INDIAN GREEN CARDAMOM COMPANY LIMITED(8.94%, $21.35 Million)
2.PACE VENTURES PVT LTD(6.13%, $14.63 Million)
3.THE KERALA CARDAMOM PROCESSING AND MARKETING CO LTD(5.84%, $13.94 Million)
4.NELIXIA HONDURAS S A DE C V(3.06%, $7.31 Million)
5.ADANI FOOD PRODUCTS PVT LTD(2.88%, $6.89 Million)
6.HỘ KINH DOANH ĐỖ NGỌC HÙNG(2.76%, $6.58 Million)
7.BHOJRAJ JAIN(2.39%, $5.7 Million)
8.KOKO SPICES PRIVATE LIMITED(1.92%, $4.58 Million)
9.CHAIZUP BEVERAGES LLP(1.73%, $4.13 Million)
10.VALUE BEVERAGE(1.7%, $4.07 Million)

Top Exporters of Cardamoms
Here are the top 20 countries ranked by the highest export value of cardamoms in 2023, regardless of processing:
1.Guatemala: $361.6 million (45.2%)
2.India: $102.3 million (12.8%)
3.United Arab Emirates: $101.3 million (12.7%)
4.Nepal: $66.6 million (8.3%)
5.Indonesia: $65.6 million (8.2%)
6.Saudi Arabia: $21.2 million (2.6%)
7.Bhutan: $14.9 million (1.9%)
8.Singapore: $12.1 million (1.5%)
9.Netherlands: $10.1 million (1.3%)
10.Türkiye: $7.4 million (0.9%)
11.Germany: $5.6 million (0.7%)
12.Jordan: $4 million (0.5%)
13.Vietnam: $2.9 million (0.4%)
14.United Kingdom: $2.9 million (0.4%)
15.France: $2 million (0.2%)
16.Kuwait: $1.8 million (0.2%)
17.Honduras: $1.7 million (0.2%)
18.Sweden: $1.4 million (0.2%)
19.Sri Lanka: $1.35 million (0.2%)
20.United States: $1.35 million (0.2%)
Together, these 20 countries accounted for 98.5% of total cardamom exports.
Among these exporters, Sri Lanka saw the largest year-over-year growth, up 838.2%, followed by Türkiye (up 177.7%), Jordan (up 164.3%), and Saudi Arabia (up 60%).
Meanwhile, notable declines were recorded for the Netherlands (-44.9%), Vietnam (-42.8%), India (-34%), Sweden (-28.1%), and the United Kingdom (-19.9%).
Top Importers of Cardamoms
The total expenditure on imported cardamoms increased by 3% over five years, but dropped by -15.3% from 2022 to 2023.
Below are the top 20 importing countries by value in 2023:
1.Saudi Arabia: $141.1 million (18.2%)
2.United Arab Emirates: $120.5 million (15.6%)
3.India: $86.1 million (11.1%)
4.Mainland China: $69.8 million (9%)
5.Bangladesh: $41.3 million (5.3%)
6.Jordan: $30.9 million (4%)
7.Egypt: $28.9 million (3.7%)
8.Yemen: $21.7 million (2.8%)
9.Kuwait: $17.9 million (2.3%)
10.United States: $17.4 million (2.2%)
11.Iraq: $14.5 million (1.9%)
12.Singapore: $13.7 million (1.8%)
13.Pakistan: $11.9 million (1.5%)
14.Türkiye: $11.9 million (1.5%)
15.Syria: $11 million (1.4%)
16.Oman: $10.1 million (1.3%)
17.Nepal: $10.1 million (1.3%)
18.Iran: $9.7 million (1.3%)
19.United Kingdom: $7.8 million (1%)
20.Qatar: $7.1 million (0.9%)
These markets together accounted for 88.3% of the global cardamom imports in 2023.
Among the leading buyers, the most significant increases came from Türkiye (up 81.3%), Nepal (up 70.5%), Yemen (up 70.1%), and India (up 52.8%).
On the other hand, sharp declines were seen in Pakistan (-49.1%), United States (-42.4%), Iran (-40.7%), Qatar (-40.5%), and Bangladesh (-36.6%).
Tendata provides 850 million+ contact information for 500 million companies
in 228+ countries around the world, including phone number, email, LinkedIn, Facebook,
Instagram, Twitter, Youtube and other contact information. These contact
information are verified to ensure that you can contact customers.
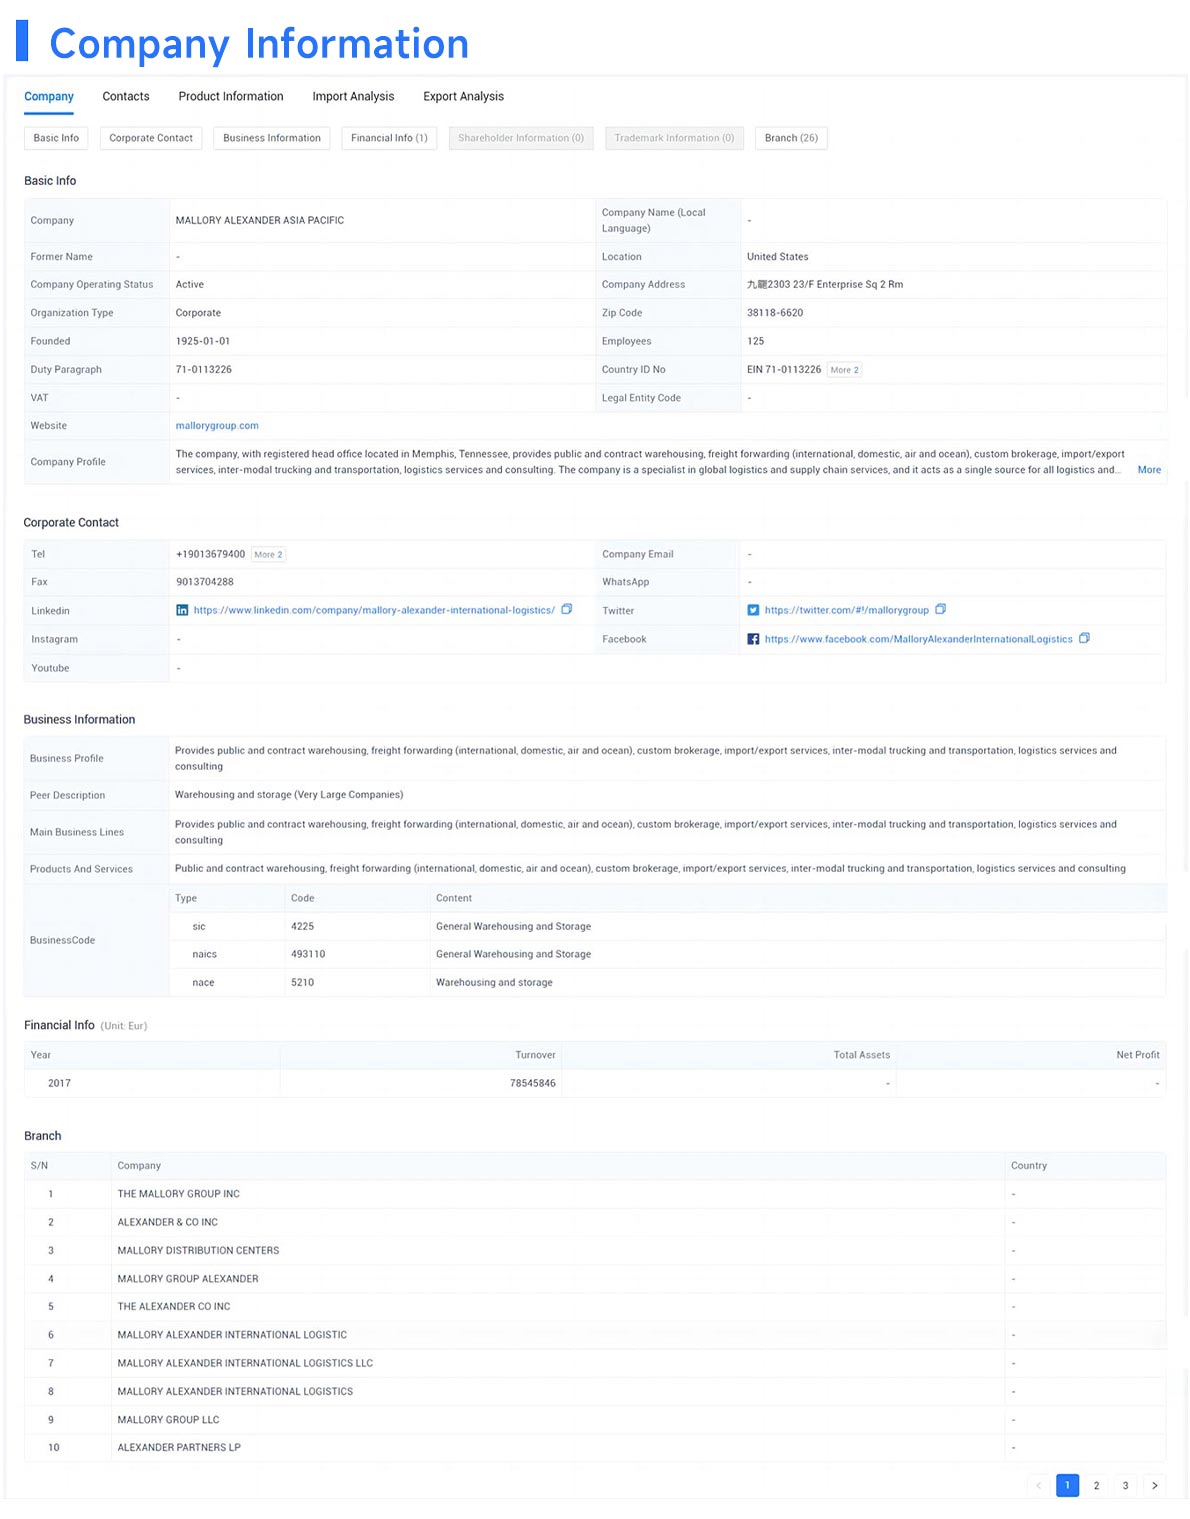
In addition, Tendata also provides basic information about companies, including branches, equity relationships, main products, business relationships, news and public opinion, intellectual property rights, etc. You can use this information to conduct background checks on companies.
Tendata also provides import or export analysis of companies, including trade trends, product HS codes, supply chain information, country of origin or country of supplier, ports, etc. You can track the latest developments of companies and find out if they have the latest needs.
We show you Tendata's corporate information cases: >>Request for Free Demo

Category
Leave Message for Demo Request or Questions


 T-info
 T-discovery

 My
Tendata
 Market Analysis
 Customer
Development
 Competitor
Monitoring
 Customer Relationship


