 Trade Data
 2025-04-30
In 2023, global hazelnut exports reached approximately $1.97 billion in value.
Compared to 2019, this reflects an overall decrease of 2.5%, as the total value stood at around $2 billion five years ago. However, from 2022 to 2023, global export revenues for hazelnuts—known for their rich, nutty flavor—rose by 9.9%, up from $1.8 billion.
Often referred to as filberts or cobnuts, hazelnuts come from the hazel tree and are widely used in the confectionery industry to produce pralines, chocolate truffles, hazelnut spreads, and a variety of pastry and dessert items. They're also essential in various flavoring pastes and powders.
In 2023, the top five hazelnut-exporting countries—Türkiye, Chile, Italy, the United States, and Azerbaijan—accounted for a commanding 85.4% share of all global hazelnut exports.
From a regional standpoint, Asian countries led hazelnut exports by value, shipping $1.21 billion worth, which equated to 61.6% of total global exports. Europe followed with 19.4%, and Latin America contributed 12%, excluding Mexico but including Caribbean nations. Other contributions came from North America (7%), Africa (0.01%), and Oceania (0.003%), mainly from Australia.
Turning to imports, the largest buyers of hazelnuts in 2023 were Germany, Italy, France, Canada, and Russia. Combined, these five countries purchased 68.4% of the world’s imported hazelnuts, based on total value.
The data suggests a high concentration among exporters, with just over 60 exporting countries and the top five supplying 85.4% of global exports. In contrast, nearly 160 countries imported hazelnuts, with the top five importers accounting for a smaller share.
From a continental lens, Europe received 77.1% of the hazelnuts traded globally in 2023. This was followed by North America (7.08%), Asia (7.05%), Latin America (4.1%), Africa (3.6%), and Oceania (1.1%), led by Australia and New Zealand.
For classification purposes, hazelnuts fall under the Harmonized Tariff System (HTS) codes:
·080221 for in-shell hazelnuts (fresh or dried)
·080222 for shelled hazelnuts (fresh or dried)
In 2023, shelled hazelnuts represented 93.9% of total hazelnut export value, up from 92.4% in 2022. The share for in-shell hazelnuts declined from 7.6% to 6.1%.

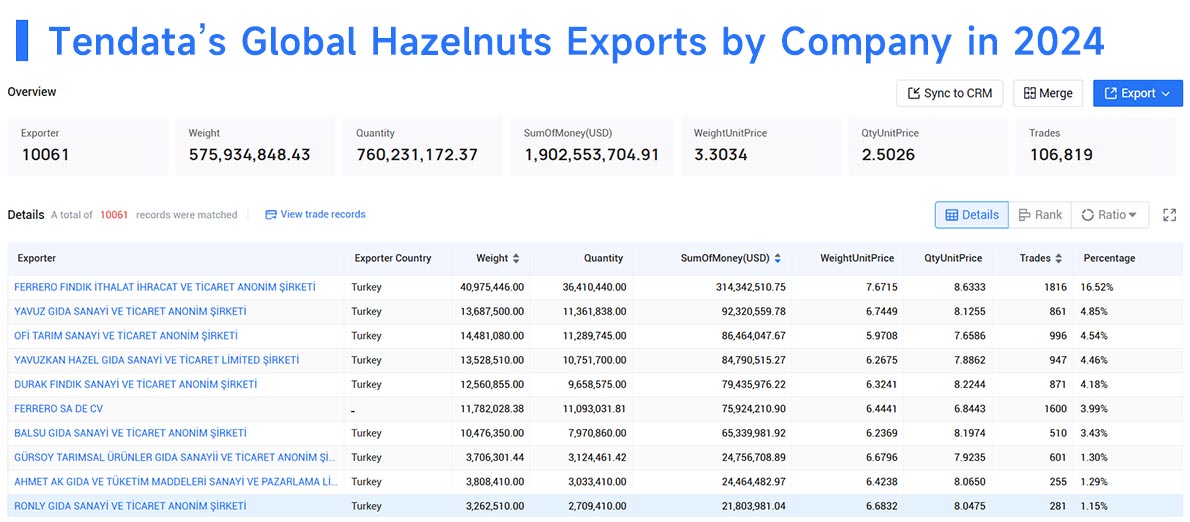
Top Hazelnuts Exports by Company in 2024
1.FERRERO FINDIK İTHALAT İHRACAT VE TİCARET ANONİM ŞİRKETİ(16.52%, $314.34 Million)
2.YAVUZ GIDA SANAYİ VE TİCARET ANONİM ŞİRKETİ(4.85%, $92.32 Million)
3.OFİ TARIM SANAYİ VE TİCARET ANONİM ŞİRKETİ(4.54%, $86.46 Million)
4.YAVUZKAN HAZEL GIDA SANAYİ VE TİCARET LİMİTED ŞİRKETİ(4.46%, $84.79 Million)
5.DURAK FINDIK SANAYİ VE TİCARET ANONİM ŞİRKETİ(4.18%, $79.44 Million)
6.FERRERO SA DE CV(3.99%, $75.92 Million)
7.BALSU GIDA SANAYİ VE TİCARET ANONİM ŞİRKETİ(3.43%, $65.34 Million)
8.GÜRSOY TARIMSAL ÜRÜNLER GIDA SANAYİİ VE TİCARET ANONİM ŞİRKETİ(1.3%, $24.76 Million)
9.AHMET AK GIDA VE TÜKETİM MADDELERİ SANAYİ VE PAZARLAMA LİMİTED ŞİRKETİ(1.29%, $24.46 Million)
10.RONLY GIDA SANAYİ VE TİCARET ANONİM ŞİRKETİ(1.15%, $21.8 Million)

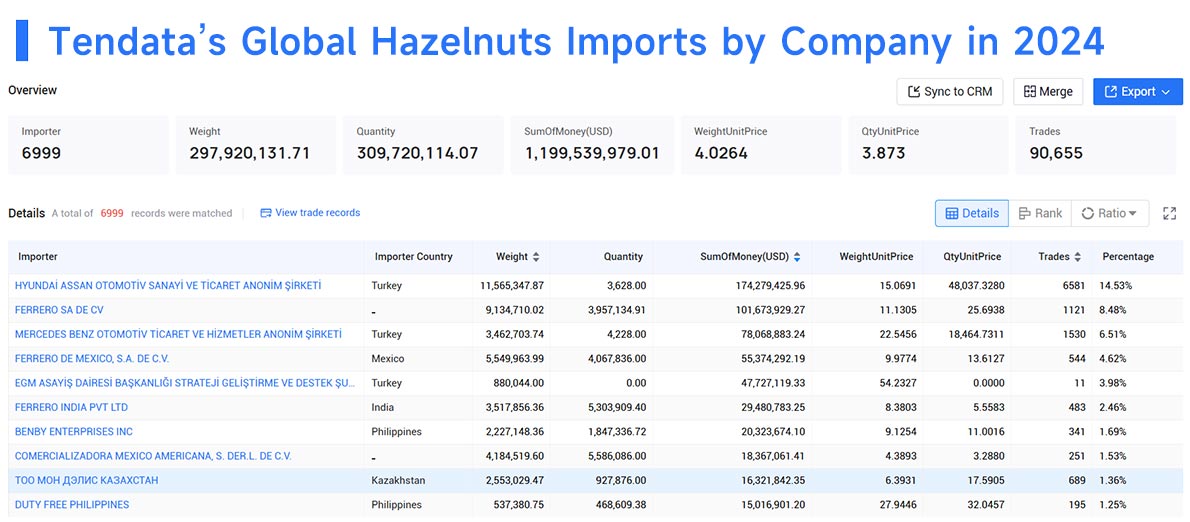
Top Hazelnuts Imports by Company in 2024
1.HYUNDAİ ASSAN OTOMOTİV SANAYİ VE TİCARET ANONİM ŞİRKETİ(14.53%, $174.28 Million)
2.FERRERO SA DE CV(8.48%, $101.67 Million)
3.MERCEDES BENZ OTOMOTİV TİCARET VE HİZMETLER ANONİM ŞİRKETİ(6.51%, $78.07 Million)
4.FERRERO DE MEXICO, S.A. DE C.V.(4.62%, $55.37 Million)
5.EGM ASAYİŞ DAİRESİ BAŞKANLIĞI STRATEJİ GELİŞTİRME VE DESTEK ŞUBE MÜDÜRLÜĞÜ(3.98%, $47.73 Million)
6.FERRERO INDIA PVT LTD(2.46%, $29.48 Million)
7.BENBY ENTERPRISES INC(1.69%, $20.32 Million)
8.COMERCIALIZADORA MEXICO AMERICANA, S. DER.L. DE C.V.(1.53%, $18.37 Million)
9.ТОО МОН ДЭЛИС КАЗАХСТАН(1.36%, $16.32 Million)
10.DUTY FREE PHILIPPINES(1.25%, $15.02 Million)

Top Hazelnut Exporting Countries in 2023
These countries exported the highest dollar values of hazelnuts (shelled and in-shell combined):
1.Türkiye – $996.6 million (50.6%)
2.Chile – $236.7 million (12%)
3.Italy – $187.2 million (9.5%)
4.United States – $137.7 million (7%)
5.Azerbaijan – $123.1 million (6.3%)
6.Georgia – $82.8 million (4.2%)
7.Germany – $58 million (2.9%)
8.Netherlands – $44.6 million (2.3%)
9.Spain – $32.2 million (1.6%)
10.France – $17.4 million (0.9%)
11.Czech Republic – $7 million (0.4%)
12.Serbia – $6.4 million (0.3%)
13.Poland – $6.2 million (0.3%)
14.Armenia – $3.7 million (0.2%)
15.Hong Kong – $3.6 million (0.2%)
16.Austria – $2.8 million (0.1%)
17.Belgium – $2.7 million (0.1%)
18.Romania – $2.6 million (0.1%)
19.Lithuania – $2.5 million (0.1%)
20.Croatia – $2.3 million (0.1%)
These 20 countries together were responsible for 99.3% of global hazelnut exports in 2023.
Notable Export Growth and Decline
Fastest-growing exporters (2022–2023):
·Hong Kong (+3,805%)
·Romania (+872.4%)
·Serbia (+256.1%)
·Chile (+96.2%)
·Largest declines:
·Armenia (−33.7%)
·Georgia (−13.8%)
·Czech Republic (−11.3%)
·Lithuania (−10.7%)
·United States (−3.9%)
Top Hazelnut Importing Countries in 2023
Over the five-year period since 2019, total global spending on hazelnut imports decreased by 1.1%, but compared to 2022, spending rose by 10.9%.
Here are the leading 20 countries by import value:
1.Germany – $526.2 million (28.3%)
2.Italy – $378 million (20.3%)
3.France – $153.5 million (8.3%)
4.Canada – $123.6 million (6.6%)
5.Russia – $91.7 million (4.9%)
6.Brazil – $72.7 million (3.9%)
7.Switzerland – $64.3 million (3.5%)
8.Poland – $48.5 million (2.6%)
9.Austria – $40.3 million (2.2%)
10.Spain – $39.4 million (2.1%)
11.Netherlands – $37.8 million (2%)
12.Belgium – $31.7 million (1.7%)
13.China (mainland) – $21.1 million (1.1%)
14.Australia – $19.9 million (1.1%)
15.Algeria – $18.7 million (1%)
16.Libya – $17.9 million (1%)
17.Türkiye – $17.2 million (0.9%)
18.United Kingdom – $16.2 million (0.9%)
19.Egypt – $15.2 million (0.8%)
20.Czech Republic – $11.7 million (0.6%)
Together, these countries purchased 93.8% of all imported hazelnuts in 2023.
Import Trends
Top growth markets since 2022:
·Algeria (+68.1%)
·Canada (+44.6%)
·Brazil (+35.2%)
·Belgium (+26.7%)
Countries with declining import values:
·China (−38.6%)
·Austria (−35.6%)
·UK (−10.8%)
·Australia (−10%)
·Türkiye (−3.7%)
Tendata provides 850 million+ contact information for 500 million companies
in 228+ countries around the world, including phone number, email, LinkedIn, Facebook,
Instagram, Twitter, Youtube and other contact information. These contact
information are verified to ensure that you can contact customers.
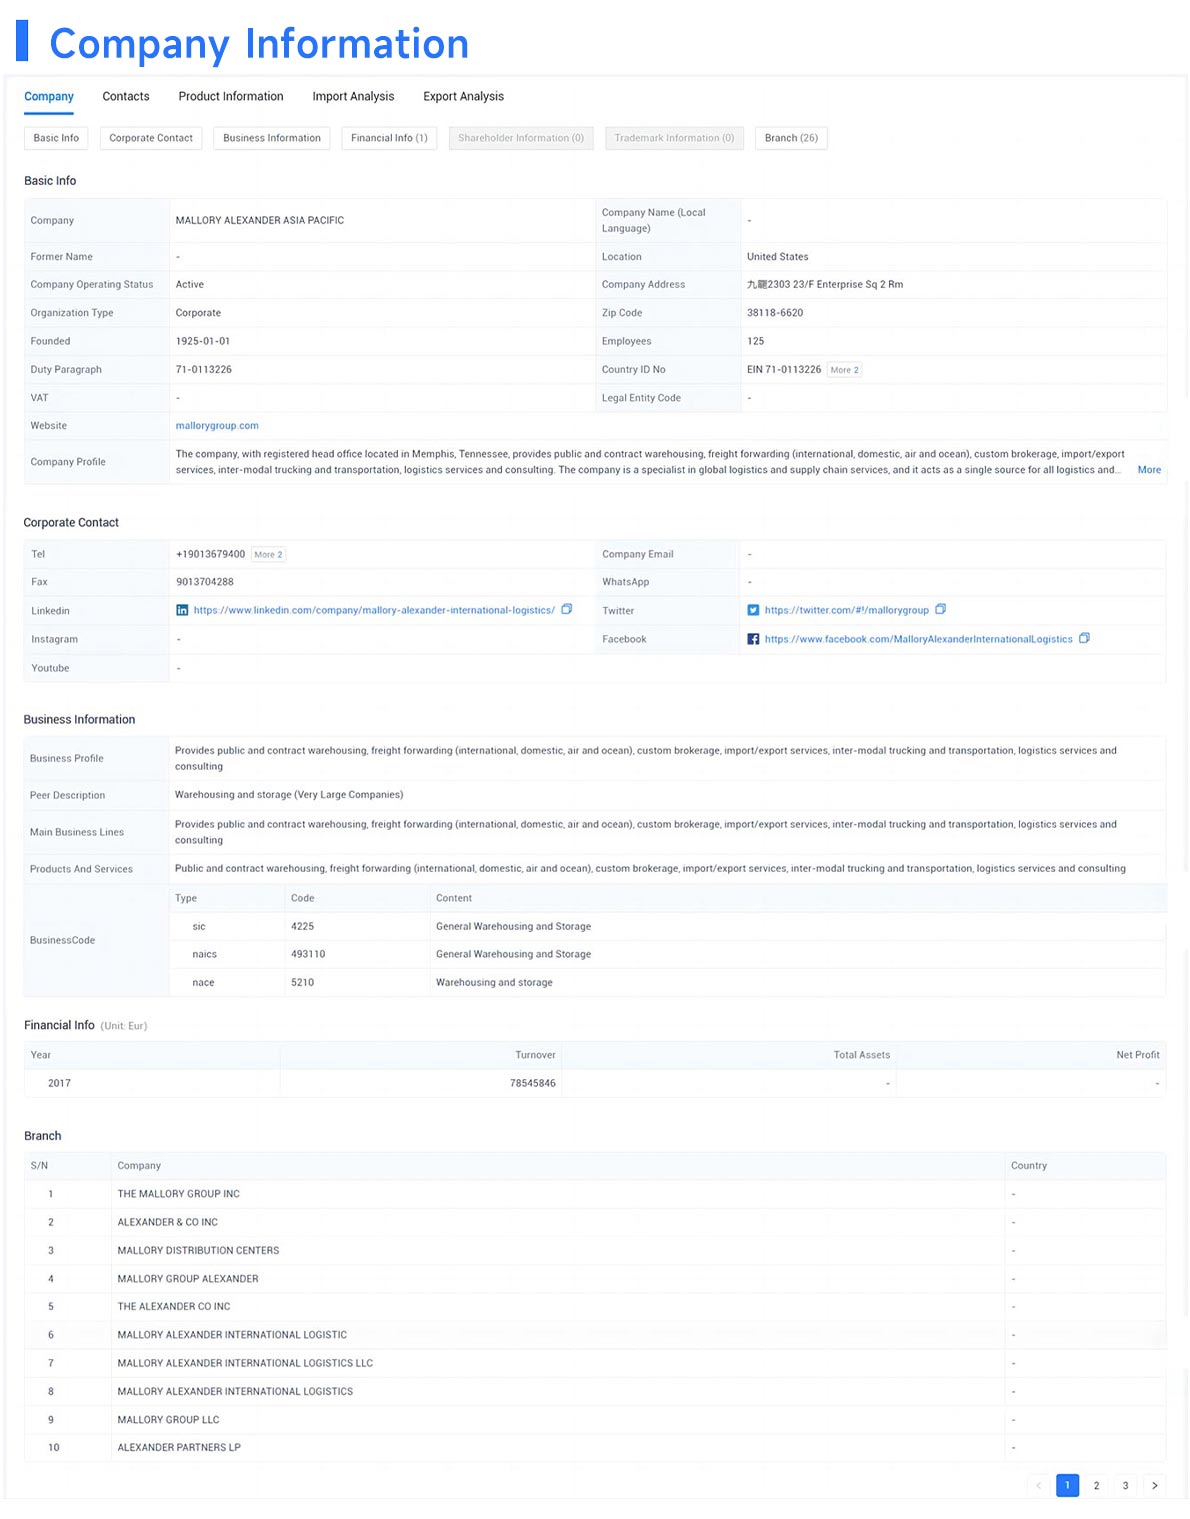
In addition, Tendata also provides basic information about companies, including branches, equity relationships, main products, business relationships, news and public opinion, intellectual property rights, etc. You can use this information to conduct background checks on companies.
Tendata also provides import or export analysis of companies, including trade trends, product HS codes, supply chain information, country of origin or country of supplier, ports, etc. You can track the latest developments of companies and find out if they have the latest needs.
We show you Tendata's corporate information cases: >>Request for Free Demo

Category
Leave Message for Demo Request or Questions


 T-info
 T-discovery

 My
Tendata
 Market Analysis
 Customer
Development
 Competitor
Monitoring
 Customer Relationship


