Tendata AI
  Exhibition
 B2B Platforms
 Standalone Website
 Social Media
 Emails
 Export News
 2026-07-14
Global exports of plastic products generated approximately US$106.2 billion in revenue in 2025, reflecting the strong international demand for various plastic articles across industries.
Over the past five years, worldwide shipments of plastic items increased slightly by 2.2% compared with 2021, when global exports were valued at around $103.9 billion.
Compared with 2024, exports of plastic-made products recorded a 2.7% year-on-year increase, rising from $103.4 billion.
The leading exporters of plastic articles worldwide are mainland China, Germany, the United States, France and Italy. Together, these five major suppliers accounted for 57.4% of total global plastic item exports in 2025, highlighting the concentration of supply among a few dominant markets.
From a regional perspective, Asian exporters generated the largest share of global plastic article exports, contributing 44.1% of worldwide export value. European suppliers ranked second with 41.3%, followed by exporters from North America with 12.7%.
The remaining exports were supplied by countries in Africa (0.9%), Latin America (0.8%) excluding Mexico but including Caribbean markets, and Oceania (0.2%), mainly Australia and New Zealand.
For trade classification purposes, plastic articles are categorized under the 4-digit Harmonized Tariff System (HTS) code 3926.

Top Plastic Item Exporters by Country
The following 15 countries recorded the highest export values for plastic products in 2025:
1. Mainland China: US$32 billion (30.1% of global plastic item exports)
2. Germany: $12 billion (11.3%)
3. United States: $9.3 billion (8.8%)
4. France: $3.9 billion (3.6%)
5. Italy: $3.8 billion (3.6%)
6. Poland: $3.7 billion (3.5%)
7. Mexico: $2.92 billion (2.8%)
8. Netherlands: $2.90 billion (2.7%)
9. Czech Republic: $2.6 billion (2.5%)
10. Japan: $2.1 billion (2%)
11. Vietnam: $1.96 billion (1.8%)
12. Taiwan: $1.83 billion (1.7%)
13. United Kingdom: $1.81 billion (1.7%)
14. South Korea: $1.78 billion (1.7%)
15. Belgium: $1.68 billion (1.6%)
Collectively, these 15 countries represented 79.4% of global plastic product exports in 2025, demonstrating the highly concentrated nature of the international plastics supply chain.
Among the top exporters, the fastest-growing markets between 2024 and 2025 were:
· Vietnam: +25.4%
· Poland: +10.3%
· Netherlands: +10.1%
· Czech Republic: +9.8%
Meanwhile, mainland China was the only major exporter among the top suppliers to experience a decline, with export value decreasing by 3.1% year over year.
Plastic Item Exporting Companies
According to Tendata global trade data, the following companies were among the leading exporters involved in plastic item shipments in 2025:
1. MICRON MEMORY MALAYSIA SDN BHD (1.65%, $3,095.91 Million)
2. CÔNG TY CỔ PHẦN THƯƠNG MẠI SẢN XUẤT XUẤT KHẨU PHÚC LÂM (1.65%, $3,088.85 Million)
3. BMW AG WERK MUENCHEN W 1 1 (1.5%, $2,800.46 Million)
4. TOYOTA MOTOR CORPORATION (1.18%, $2,204.7 Million)
5. SCANIA CV AB PUBL (0.96%, $1,803.83 Million)
6. HYUNDAI GLOVIS CO LTD (0.78%, $1,457.57 Million)
7. YAMAHA MOTOR ASIA PTE LTD (0.64%, $1,192.38 Million)
8. YAMAHA MOTOR CO LTD (0.62%, $1,154.56 Million)
9. TCL SMART SCREEN TECHNOLOGY HK LTD (0.57%, $1,075.75 Million)
10. VOLKSWAGEN AG (0.54%, $1,017.1 Million)
>>Find More Plastics Item Exporters through Tendata<<
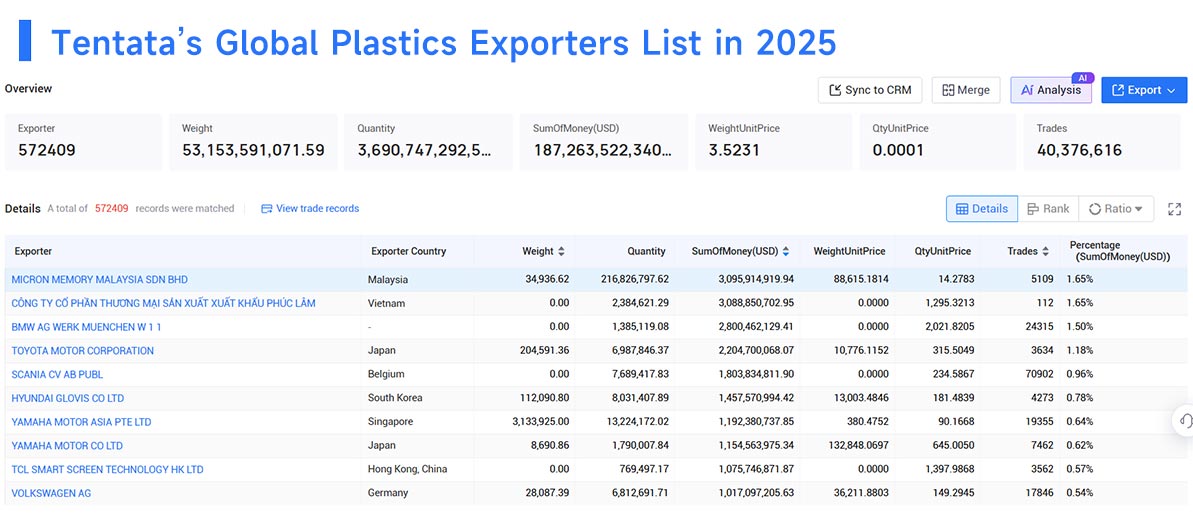
With detailed shipment records, supplier information, and company-level trade insights, Tendata Global Trade Data Intelligence Platform helps businesses identify leading plastic exporters, analyze global supply chains, and discover reliable international trading partners.
Category
Leave Message for Demo Request or Questions