Tendata AI
  Exhibition
 B2B Platforms
 Standalone Website
 Social Media
 Emails
 Export News
 2026-03-13
Paraguay, a landlocked country in South America bordered by Brazil, Argentina, and Bolivia, exported goods worth about US$12.3 billion to global markets in 2025.
Compared with $10.6 billion in 2021, Paraguay's export value increased by approximately 16.4% over five years. On a year-to-year basis, export revenue also grew significantly, rising 13.9% from $10.8 billion in 2024 to the 2025 total.
Based on the average exchange rate in 2025, the Paraguayan guaraní strengthened 10.2% against the US dollar compared with 2021, although it slipped slightly by 0.2% between 2024 and 2025. A stronger local currency since 2021 means that Paraguayan products priced in US dollars have become somewhat more expensive for international buyers.
Major Overseas Buyers of Paraguayan Goods
Recent trade data indicates that 89.2% of Paraguay's exports were purchased by a group of key international markets. The largest importer was Brazil, which accounted for 35.1% of Paraguay's total exports. Other important destinations included Argentina (29.4%), Chile (8%), and the United States (4.8%).
Additional buyers were Taiwan (2.8%), Israel (2.1%), Uruguay (1.6%), Russia (1.3%), Netherlands (1.2%), India (1.05%), Bolivia (0.98%), and Peru (0.86%).
From a regional viewpoint, Latin America remained the primary destination, absorbing 76.8% of Paraguay's exports (excluding Mexico but including Caribbean countries). Asia represented 9.4% of export demand, while North America accounted for 5.9%.
Smaller portions of Paraguay's exports went to Europe (5.8%), Africa (2%), and Oceania (0.1%), mainly Australia and New Zealand.
With a population of around 7 million, Paraguay's $12.3 billion in exports during 2025 equates to roughly $1,750 per person, exceeding the $1,550 per capita recorded in 2024.

Paraguay's Top 10 Export Categories
At the 2-digit Harmonized Tariff System (HTS) level, the following product categories generated the highest export revenue for Paraguay in 2025:
1.Oil seeds – $2.7 billion (21.6% of total exports)
2.Mineral fuels including oil – $2.4 billion (19.9%)
3.Meat – $2.2 billion (18.2%)
4.Cereals – $1.1 billion (9%)
5.Animal or vegetable fats, oils, and waxes – $729.9 million (5.9%)
6.Food industry waste and animal feed – $686.7 million (5.6%)
7.Electrical machinery and equipment – $438.4 million (3.6%)
8.Aluminum – $183.3 million (1.5%)
9.Other chemical products – $143.7 million (1.2%)
10.Miscellaneous textiles and worn clothing – $101.9 million (0.8%)
Combined, these ten export groups represented 87.2% of Paraguay's total export value.
Fastest-Growing Export Segments
Among Paraguay's major export categories, mineral fuels including oil recorded the fastest growth, surging 111.7% between 2024 and 2025.
The second-strongest increase occurred in animal and vegetable fats, oils, and waxes, which expanded 41.6%. Cereal exports also saw notable improvement, rising 24% year over year.
In contrast, oil seeds, traditionally Paraguay's largest export category, experienced the biggest decline among the top ten sectors, falling 22.1%.
Most Valuable Individual Export Products
Looking more closely at the 4-digit HTS code level, Paraguay's most profitable export products included:
1.Electrical energy – 19.9% of total exports
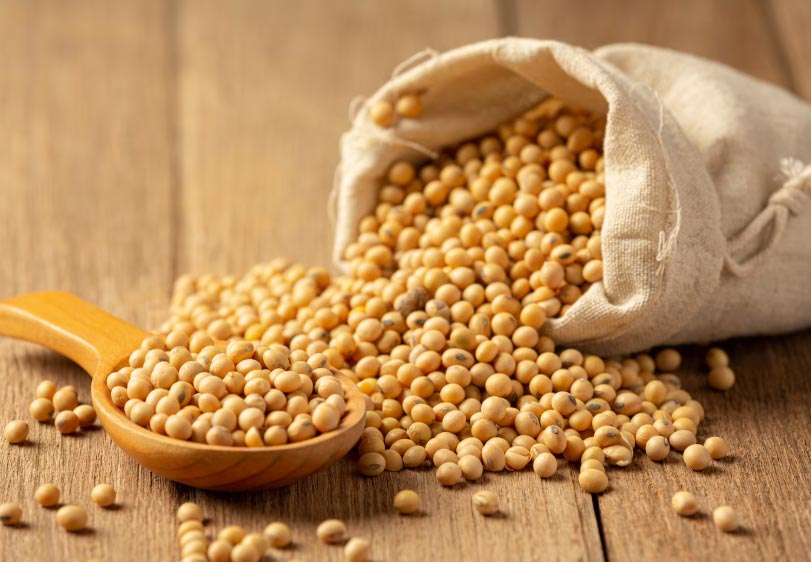
2.Soybeans – 19.1%
3.Frozen beef – 10.4%
4.Fresh or chilled beef – 6.6%
5.Soybean oil – 5%
6.Soybean oilcake and residues – 4.9%
7.Corn – 4.8%
8.Insulated wire and cable – 3.3%
9.Rice – 3%
10.Other oil seeds – 2.3%
These products highlight Paraguay's strong reliance on agriculture, livestock, and energy exports.
Paraguayan Export Companies
For businesses planning to enter Paraguay's export market, identifying trustworthy suppliers and partners is a crucial step. Using Tendata's global trade intelligence platform, companies can apply keyword searches and HS code filters to locate thousands of verified suppliers, analyze purchasing trends, and access contact details—greatly reducing the time needed to explore new opportunities.
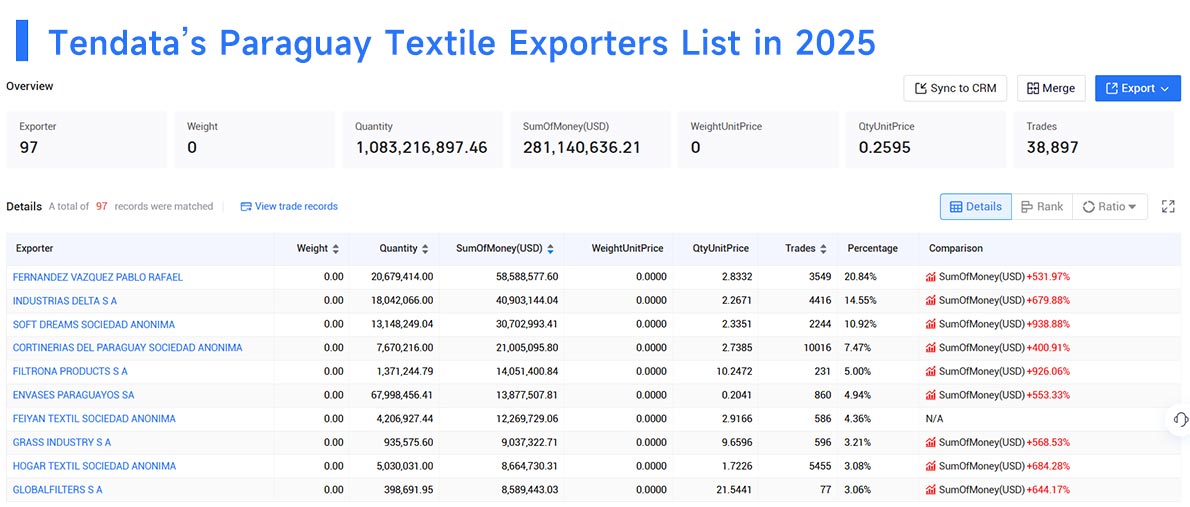
For instance, when analyzing motor-related demand, Tendata can quickly display the top suppliers in Paraguay for 2025, including:
1.FERNANDEZ VAZQUEZ PABLO RAFAEL – 20.84% ($58.59M)
2.INDUSTRIAS DELTA S A – 14.55% ($40.9M)
3.SOFT DREAMS SOCIEDAD ANONIMA – 10.92% ($30.7M)
4.CORTINERIAS DEL PARAGUAY SOCIEDAD ANONIMA – 7.47% ($21.01M)
5.FILTRONA PRODUCTS S A – 5% ($14.05M)
6.ENVASES PARAGUAYOS SA – 4.94% ($13.88M)
7.FEIYAN TEXTIL SOCIEDAD ANONIMA – 4.36% ($12.27M)
8.GRASS INDUSTRY S A – 3.21% ($9.04M)
9.HOGAR TEXTIL SOCIEDAD ANONIMA – 3.08% ($8.66M)
10.GLOBALFILTERS S A – 3.06% ($8.59M)
Whether you are an experienced exporter or just entering international trade, Paraguay's export data can reveal valuable market insights and potential business opportunities. To learn more about Paraguay's export statistics or detailed supplier information, contact Tendata for a free online demo.
Category
Leave Message for Demo Request or Questions